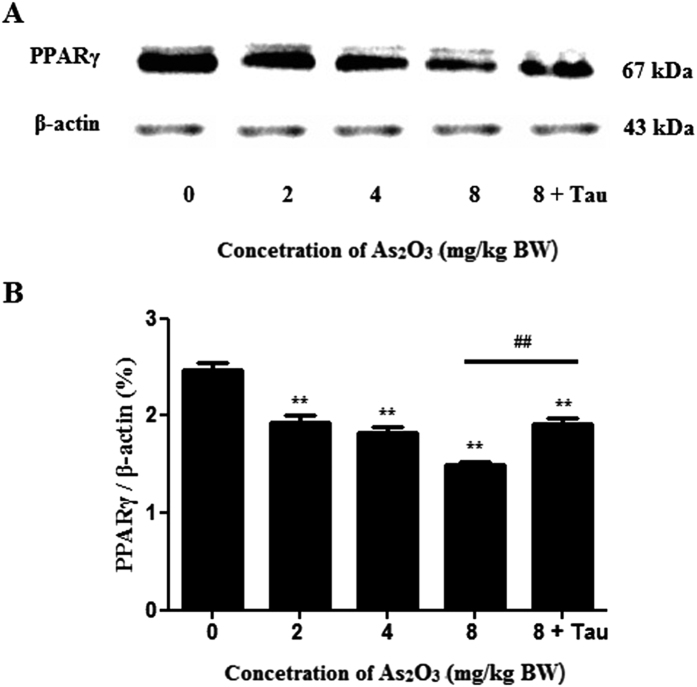
Figure 4. PPARγ protein levels in As2O3-treated livers.
(A) The rats were treated with 2 mg/kg BW to 8 mg/kg BW As2O3. The rats of group 5 were pretreated with Tau before treatment with 8 mg/kg BW As2O3. The protein fraction was analyzed by Western blot. β-actin was taken as internal control. (B) Densitometric analyses of PPARγ levels in offsprings’ livers (**P < 0.01 vs. control; ##P < 0.01).

