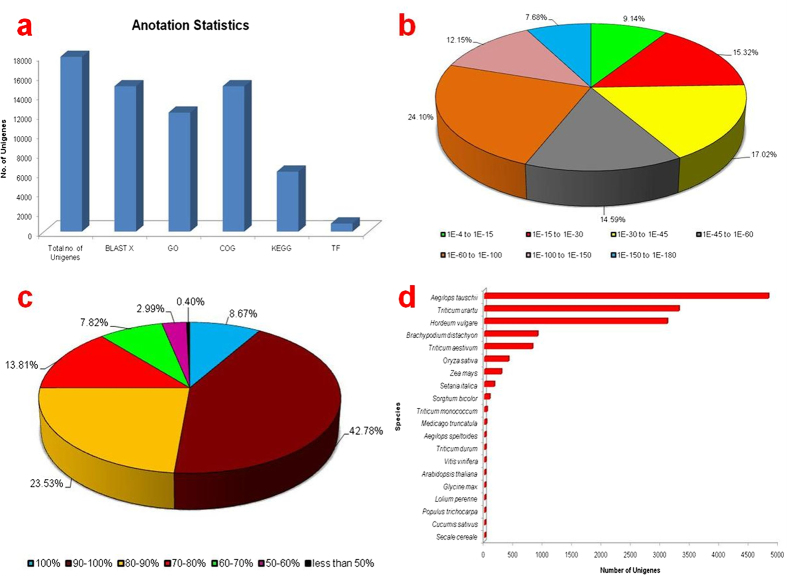
Figure 1. Homology search of T. aestivum under salt stress.
(a) Annotation statistics of T. aestivum transcriptome; (b) E-value distribution of the BLASTX hits against the nr protein database for each unigene, using an E-value cutoff of 1.0 E−3; (c) Similarity distribution of the top BLAST hits for each unigene; (d) Species distribution of sequences.

