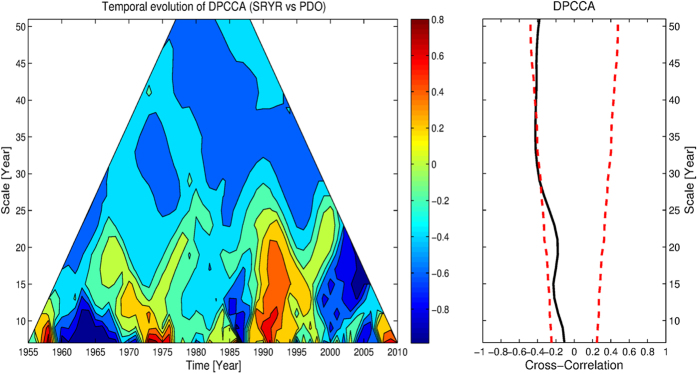
Figure 6. Temporal evolution of the correlations between SRYR and winter PDO, on different time scales.
On the left hand side (LHS) is the TDPCCA result for SRYR and PDO, where the possible effects of Nino3-SSTA have been removed. Same as Fig. 5, on the right hand side (RHS) is the DPCCA results. One can see that after the end of 1970s, there are more significant correlations between the summer rainfall over the middle-lower reaches of Yangtze River and previous winter-time PDO index.

