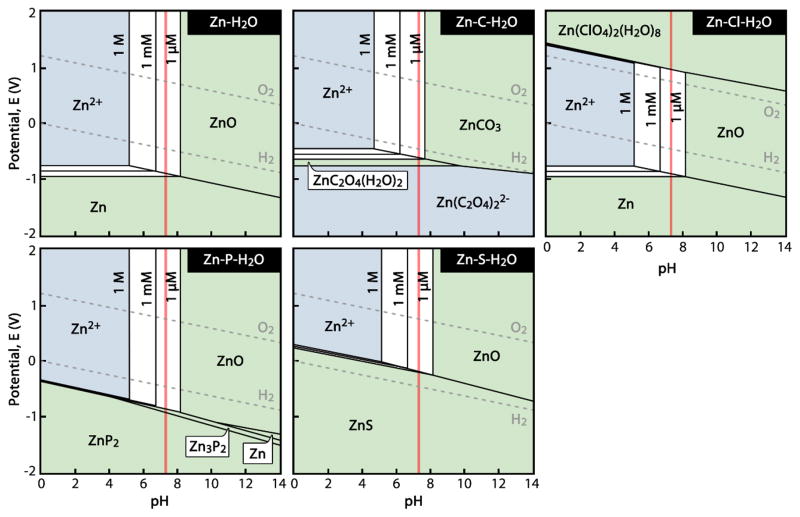
Figure 3.
Zn-H2O and Zn-H2O-X Pourbaix diagrams for physiological concentrations of X = {C, Cl, P, and S} at 37°C. Aqueous species have a light blue background, concentration-dependent regions between [Zn2+] = 1 μM and 1 M are white, and solid species are shown with green backgrounds. Physiological pH = 7.3 is shown by a red line. (Calculated using FactSage software.)

