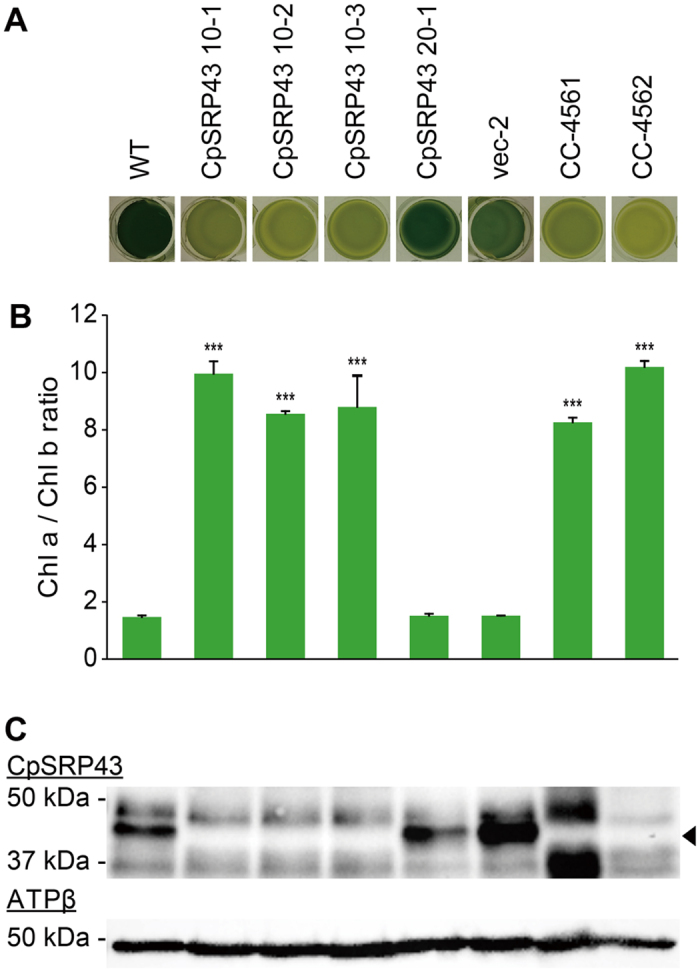
Figure 4. Phenotypic characterization of CpSRP43 mutants.

Cells were co-transformed with sgRNA, the Cas9 protein and the selection vector, and three colonies showing a stable lighter green color were isolated and designated CpSRP43 10-1, 10-2 and 10-3. The negative controls included a colony from the same screen that carried the normal green color (designated CpSRP43 20-1), and a colony from an experiment in which cells were transformed with only the selection vector (designated vec-2). The positive controls included CC-4561 (mt+) and CC-4562 (mt−), which are deletion mutants of CpSRP43 (also called tla3-cpsrp43). (A) The coloration of control colonies and those of CpSRP43 mutants induced by CRISPR/Cas9. Cells (2.50 × 10⁷ cells/mL) were loaded to a 24-well plate in identical volumes of TAP medium. (B) Changes in the chlorophyll contents of CpSRP43 mutants. The contents of chlorophyll a and b were measured at 72 hours of cultivation, normalized by the cell density. The ratios of chlorophyll a to chlorophyll b were calculated and plotted. Error bars indicate standard deviations obtained from four independent experiments. Significant differences compared to the WT were determined by the Student’s t test and are indicated by asterisk (*P < 0.05, **P < 0.01, ***P < 0.001) (C) Immunoblots were probed with antibodies against the target protein (CpSRP43) and the β-subunit of ATP synthase (ATPβ). A band of the molecular mass expected for the former (43 kDa) is marked with an arrowhead.
