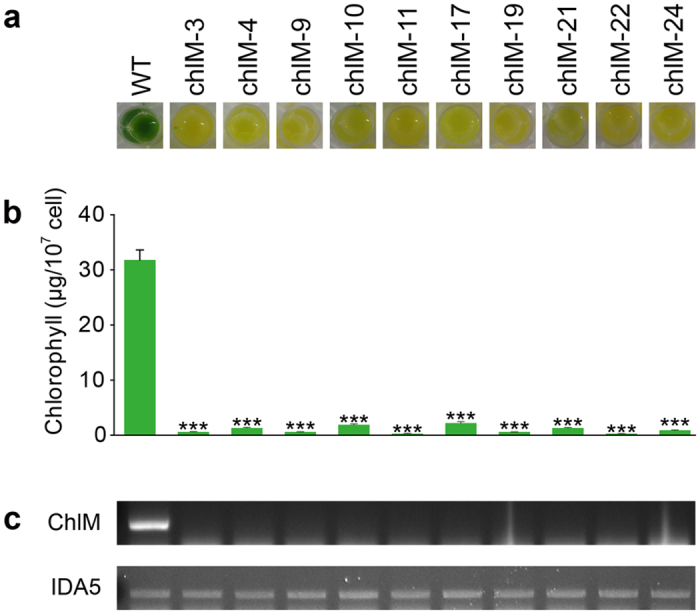
Figure 6. Phenotypic characterization of light green mutants induced by CRISPR/Cas9 at the ChlM locus.

(a) Coloration of 10 ChlM mutants (2.0 × 10⁸ cells/mL) loaded to a 24-well plate in liquid TAP medium. (b) Chlorophyll contents of the ChlM mutants. Data are expressed as ± SD (n = 4 replicates). Significant differences compared to the WT control were determined by the Student’s t test and are indicated by asterisks (*P < 0.05, **P < 0.01, ***P < 0.001). (c) Semi-quantitative RT-PCR analysis was used to detect ChlM transcripts from the mutant lines. IDA5 was detected as a loading control.
