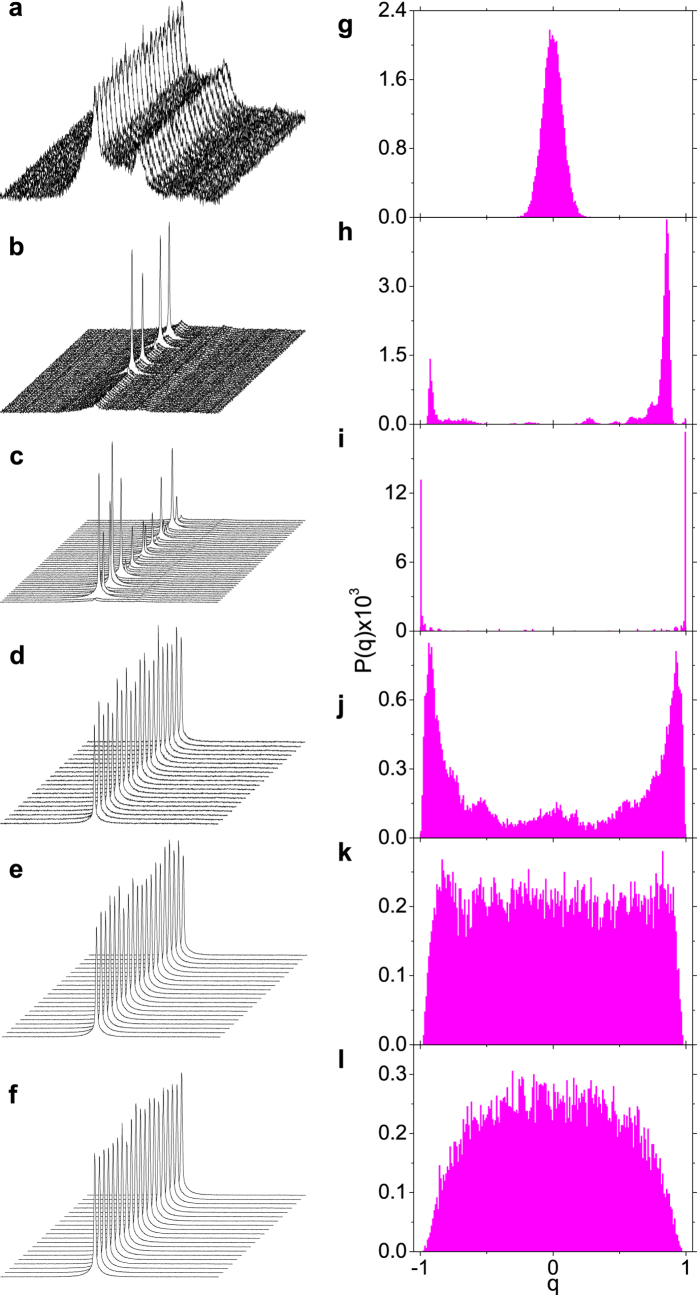
Figure 2. Pulse-to-pulse intensity fluctuations and corresponding overlap distributions signalizing the photonic RSB glassy transition.
(a–f) Intensity spectra showing the fluctuations from shot to shot of the Nd:YBO system for excitation pulse energies (a) 1.20 mJ (below the RL threshold), (b) 1.36 mJ, (c) 1.4 mJ (both around the threshold), (d) 1.60 mJ, (e) 2.20 mJ and (f) 2.80 mJ (above the threshold). (g–l) PDF distributions of the overlap parameter corresponding to the data in Fig. 2a–f. Fluctuations are stronger (Lévy-type) close to the threshold, in the critical region of the RSB transition from the prelasing paramagnetic to the saturated RL glassy behavior. As the excitation pulse energy increases well above the threshold, fluctuations decline considerably (Gaussian regime) and the SG behavior tends to be suppressed.

