
Figure 3. Lévy statistics of intensity emission and the RSB glassy transition.
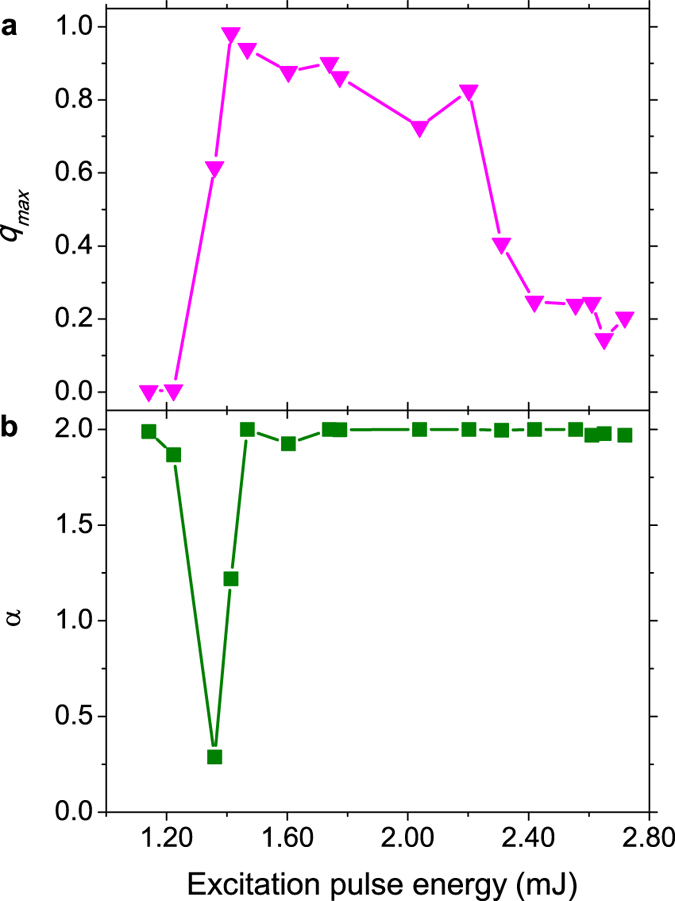
Dependence on the excitation pulse energy of (a) the value qmax at which the Parisi overlap order parameter assumes its maximum and (b) the Lévy index α calculated from the data in Fig. 2 of the Nd:YBO system. The regime of Lévy statistics (0 < α < 2) coincides with the critical region of the RSB transition to the RL glassy behavior. The value α = 2 identifies the Gaussian regimes below and above the transition. Notice that well above the threshold the SG behavior tends to be suppressed as qmax decreases.