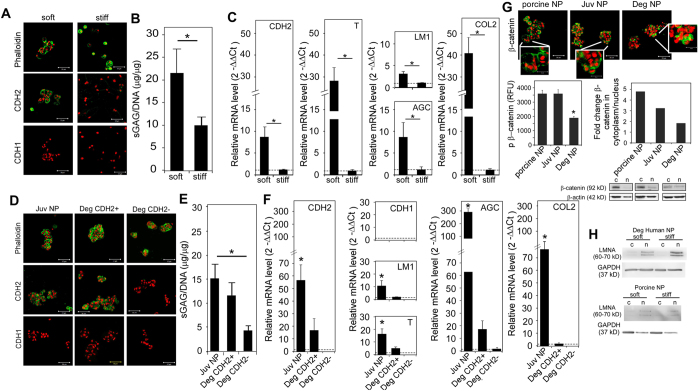
Figure 2. Porcine and human NP cells form CDH2-positive (+) cell clusters on soft, laminin (LM) hydrogels with preservation of juvenile NP phenotype.
(A) Representative immunostaining of phalloidin and cadherins for porcine NP cells on soft and stiff PEG-LM (green = protein, red = cell nuclei, scale bar = 50 μm). (B) Changes in sGAG production for porcine NP cells on soft and stiff PEG-LM. (C) Quantification of gene expression for juvenile NP cell phenotype markers in porcine NP cells on soft, relative to NP cells on stiff (CDH2 = N-cadherin, T = brachyury, LM1 = Laminin1, AGC = aggrecan, COL2 = type II collagen). (D) Representative immunostaining of phalloidin and cadherins for juvenile (juv) and degenerate (deg) human NP cells on soft PEG-LM (green = protein, red = cell nuclei, scale bar = 50 μm, CDH2 + = CDH2 positive, CDH2− = CDH2 negative). (E) Same as B but with human NP cells on PEG-LM. (F) Same as C but with human NP cells on PEG-LM (additional marker CDH1 was quantified in human). (G) Representative immunostaining for β-catenin (green) in NP cells on soft PEG-LM with associated changes in phosphorylated β-catenin, fold-change for β-catenin in the cytoplasm to nucleus, with corresponding western blot images for β-catenin (immunostaining images scale bar = 50 μm, with higher magnification inset scale bar = 20 μm). (H) Western blot images for LMNA expression on soft and stiff PEG-LM (All western blot images were cropped to display protein expression concisely; see Supplemental Figure 4 for full western blots) (For all studies: 2-way ANOVA with Tukey’s post-hoc analysis, *p < 0.05).

