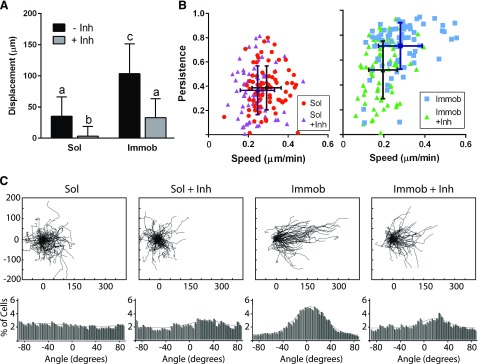
Figure 6.
Impact of pPLCγ1 inhibition on collective migration. A) Cell sheet displacement at 8 h migration. Different letters (a–c) indicate significant difference. P < 0.05. B) Cell speed and persistence of individual cells on the edge of the collective sheet over 8 h (lighter color indicates individual cells; darker color indicates population average). C) Wind rose plots (μm) and migration angles; n = 75 for each condition. Immob, immobilized; inh, inhibitor; sol, soluble.

