Figure 1.
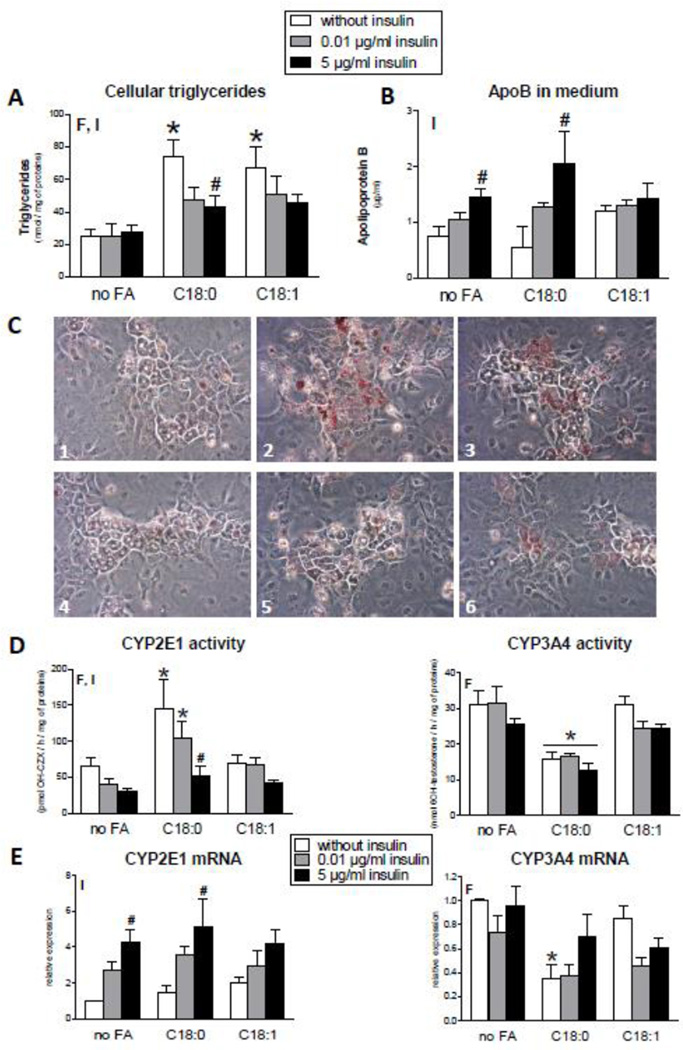
Effects of 1 week of treatment with 100 µM stearic acid (C18:0), 100 µM oleic acid (C18:1) and different concentrations of insulin on cellular triglycerides, neutral lipid deposition, apoB levels in culture medium and mRNA activity and expression of CYP2E1 and CYP3A4 in HepaRG cells. (A) Cellular triglycerides. Results are means ± SEM for 5 independent cultures, with data in duplicates for each culture. (B) ApoB levels in culture medium. Results are means ± SEM for 3 independent cultures. (C) Cellular lipids stained with oil red O. The pictures 1 to 6 (magnification × 200) are representative of the following conditions: 1) HepaRG cells incubated without insulin and fatty acids; 2) HepaRG cells incubated without insulin and with stearic acid; 3) HepaRG cells incubated without insulin and with oleic acid; 4) HepaRG cells incubated with 5 µg/ml insulin and without fatty acids; 5) HepaRG cells incubated with 5 µg/ml insulin and with stearic acid; 6) HepaRG cells incubated with 5 µg/ml insulin and with oleic acid. (D) CYP2E1 and CYP3A4 activity. Results are means ± SEM for 5 independent cultures, with data in duplicates for each culture. (E) mRNA levels of CYP2E1 and CYP3A4. Results are means ± SEM for 5 independent cultures, with data in duplicates for each culture. In panels showing bar graphs, letters F and I indicate a significant effect (P<0.05) of fatty acids and insulin, respectively. *Significantly different from HepaRG cells incubated without fatty acids and with the same condition of insulin treatment (P<0.05). #Significantly different from HepaRG cells incubated without insulin and with the same condition of fatty acid treatment (P<0.05).

