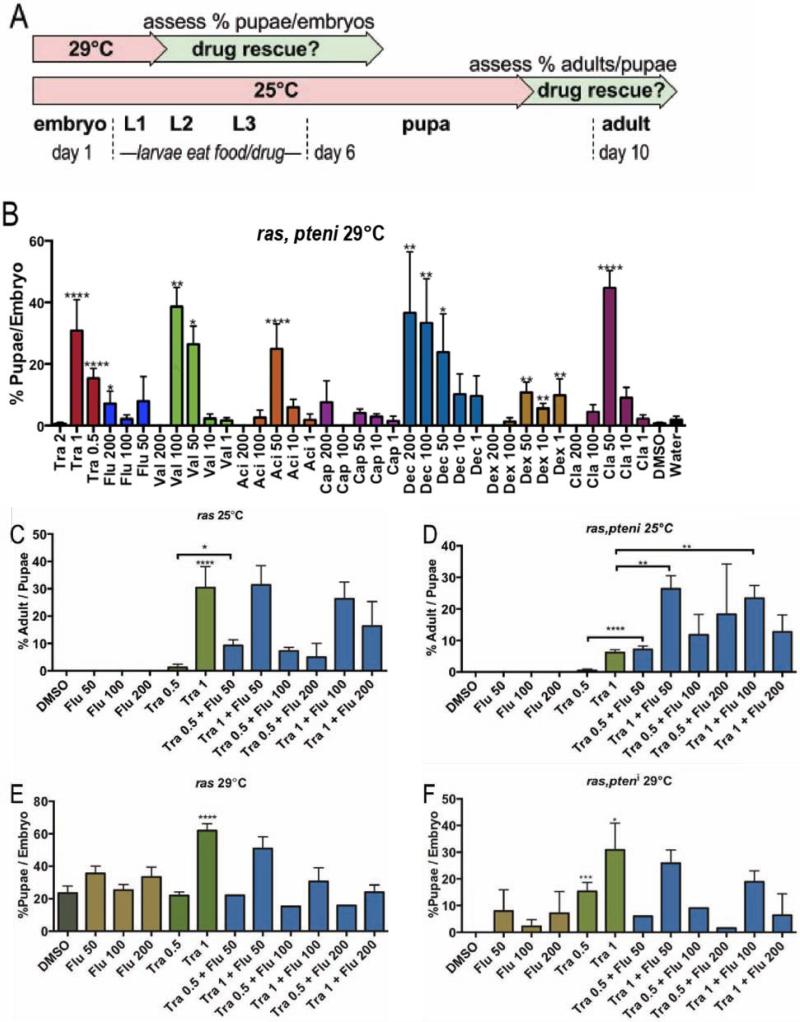
Figure 2. A lethality based large scale drug screen.
(A) Flowchart of drug experiments. btl>Ras1 combinations led to early larval lethality at 29°C and late pupal lethality at 25°C; drug efficacy was determined by measuring the ratio of pupae:embryos at 29°C or adults:pupae at 25°C.
(B) Nine positive hits from an FDA library screen were tested in larger scale format (P values are *≤0.05, **≤0.01, ***≤0.01, ****≤0.0001). All drug concentrations are μM. Tra=trametinib, Flu=fluvastatin, Val=valaciclovir, Aci=aciclovir, Cap=capecitabine, Dec=decitabine, Dex=dexrazoxane and Cla=cladrabine.
(C) 1 μM trametinib rescued btl>Ras1 pupal lethality (p≤0.0001) at 25°C. 50 μM fluvastatin + 0.5 μM trametinib rescued more fully than 0.5 μM trametinib alone (p≤0.05).
(D) 1 μM trametinib rescued blt>Ras1,PTEN larval lethality (p≤0.0001) at 25°C. Fluvastatin synergized with trametinib at select concentrations.
(E) 1 μM trametinib rescued btl>Ras1,PTENi pupal lethality (p≤0.0001) at 29°C; fluvastatin failed to improve rescue.
(F) Trametinib at 0.5 μM (p≤0.01) and 1 μM (p≤0.05) rescued btl>Ras1,PTENi larval lethality at 29°C; high levels of fluvastatin failed to improve trametinib-based rescue in experiments presented in Figures C-F, presumably due to toxicity at 200 μM.
(Values represent mean ± SEM).

