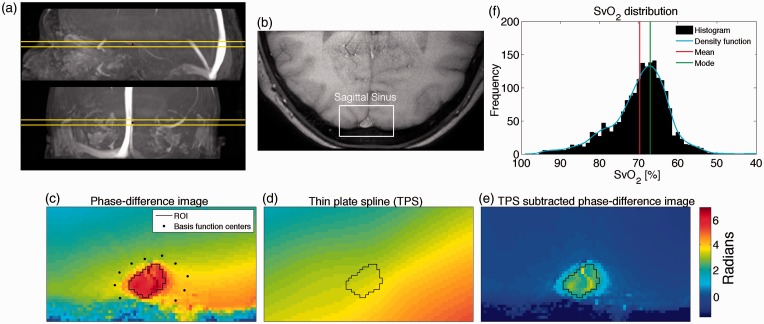
Figure 2.
(a) Sagittal and coronal view of angiography highlighting the sagittal sinus with the imaging plane visualized. (b) Part of brain covering the sagittal sinus used for calculating SvO2. (c) Phase-difference map with region of interest (ROI) in the sagittal sinus and basis function centers located in surrounding tissue used for calculating thin plate spline model (TPS). (d) Calculated TPS model. (e) Phase-difference map corrected with TPS. The field inhomogeneity is rectified and the tissue surrounding the sagittal sinus is now close to zero. (f) Example of distribution of SvO2–values from each voxel from the 10 repeated measurements in the ROI for one subject. The mode of this distribution is slightly higher than the mean.

