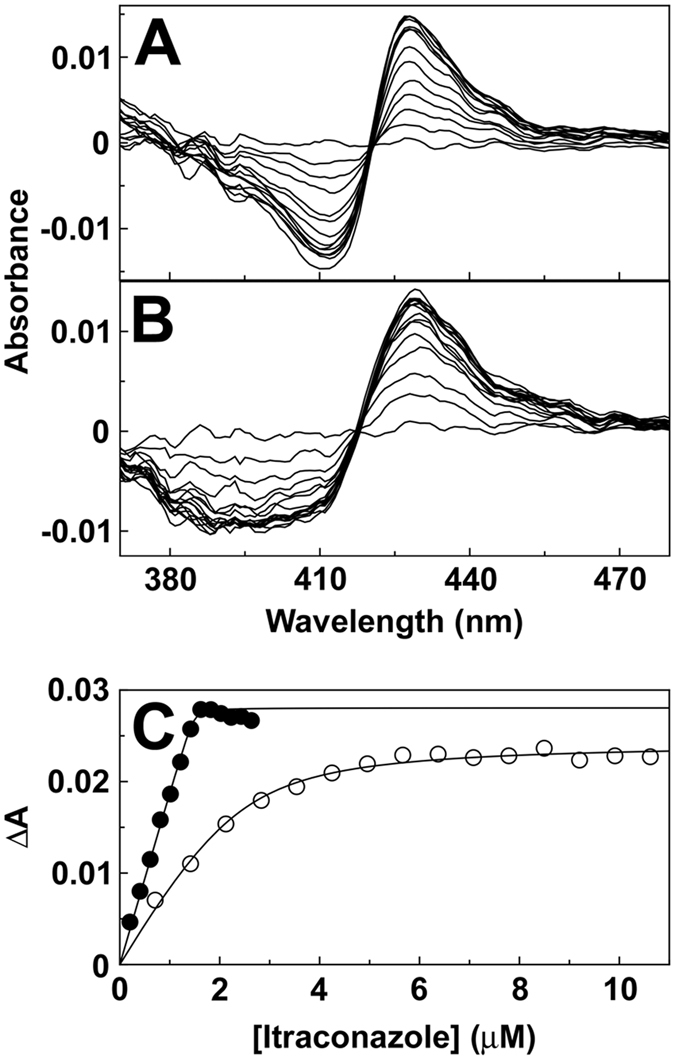
Figure 3. Type II itraconazole binding spectra.

Itraconazole was progressively titrated against 2 μM CYP51 (A) and 2 μM CYP5218 (B) with the difference spectra determined after each addition of triazole. Itraconazole saturation curves (C) were constructed from the type II absorbance difference spectra for CYP51 (filled circles) and CYP5218 (hollow circles). The data were fitted using a rearrangement of the Morrison equation47. Each experiment was performed in triplicate although only one replicate is shown.
