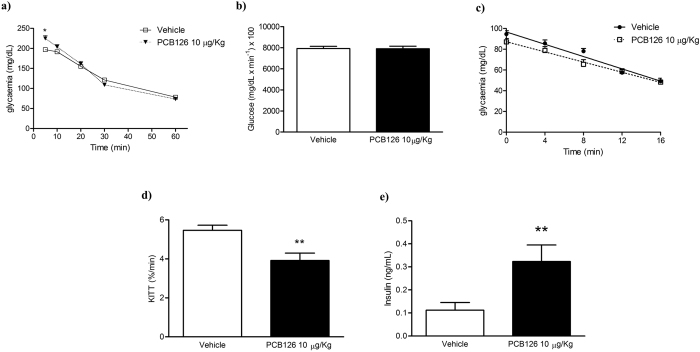
Figure 2. Effects of in vivo PCB126 10 μg/kg exposure on metabolic parameters.
(a) Glycaemia measured during GTT and (b) determination of AUC; (c) glycaemia measured during ITT and (d) KITT. Serum levels (ng/mL) of insulin (e). Data were analyzed by student’s t-test. **P < 0.01; ***P < 0.001 vs. vehicle group.

