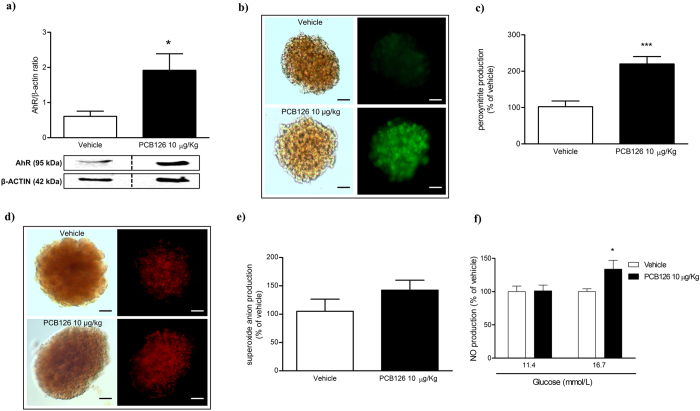
Figure 3. Effects of in vivo PCB126 10 μg/kg exposure on free radical generation on islets of Langerhans.
(a) Bars graph and representative image of AhR expression on islets of Langerhans. Representative image and bars graph showing peroxynitrite (b,c) and superoxide anion production (d,e). Determination of NO production (f) in islets cultured at physiological (11.4 mM) or high glucose levels (16.7 mM). Data were analyzed by student’s t-test (a,c,e) or two-way ANOVA (f). *P < 0.05; ***P < 0.001 vs. vehicle group.

