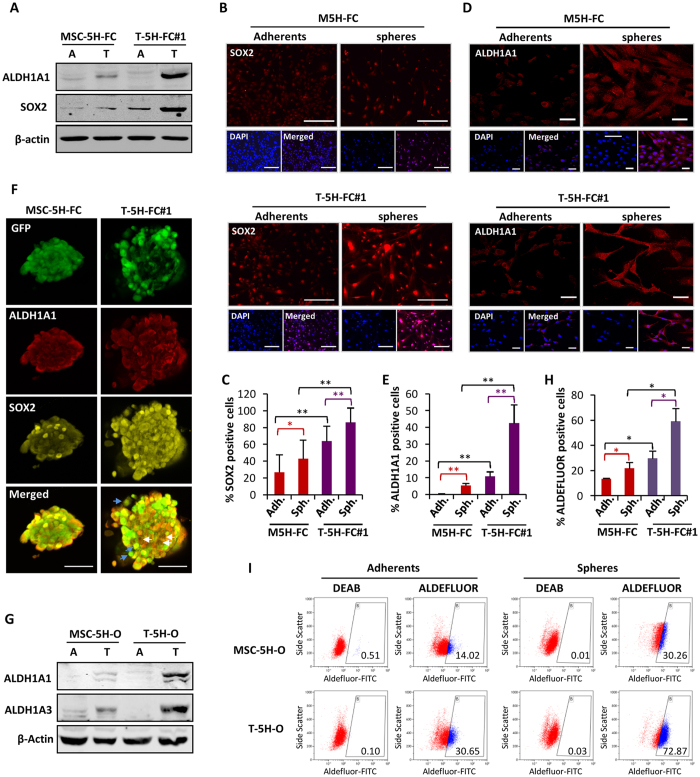
Figure 4. Increased expression of SOX2 and ALDH1 in CSC subpopulations during tumor progression.
(A) Protein levels of ALDH1A1 and SOX2 in adherent (A) and tumorsphere (T) cultures of MSC-5H-FC and T5H-FC#1. β-actin levels were used as loading control. (B,D) Immunofluorescence staining of SOX2 (B) and ALDH1A1 (D) in adherent cultures or tumorsphere disaggregates and allowed to attach to glass slides of MSC-5H-FC and T5H-FC#1 cells. Scale bars = 50 μm (B) or = 40 μm (D). (C,E) Quantification of nuclear SOX2 (C) or cytosolic and nuclear ALDH1A1 (E) staining in each sample. (F) Simultaneous immunofluorescence staining of SOX2 and ALDH1A1 in GFP-expressing MSC-5H-FC- and T5H-FC#1-derived tumorspheres. Scale bars = 200 μm. (G) Protein levels of ALDH1A1, ALDH1A3 and β-actin in adherent (A) and tumorsphere (T) cultures of the indicated cell types. (H,I) ALDEFLUOR assay showing the activity of ALDH1 in adherents and tumorspheres cultures of MSC-5H and T5H-O cells. ALDH1 activity was blocked with the specific inhibitor DEAB to establish the basal level. The summary of 3 independent experiments (I) and a representative assay (H) is presented. Error bars represent the standard deviation and asterisks indicate a statistically significant difference between the indicated conditions (*p < 0.05, **p < 0.001; two-sided Student’s t-test).

