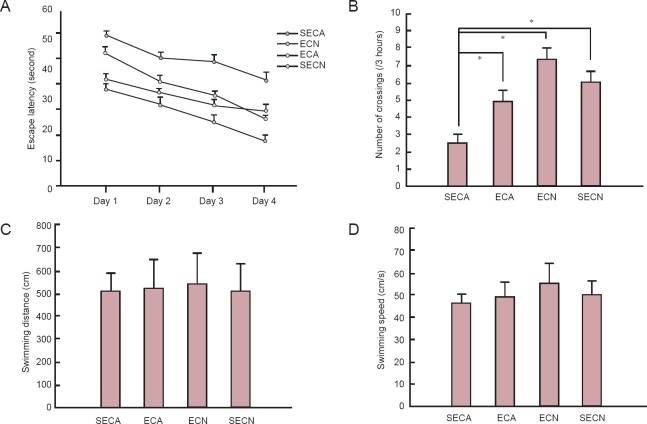
Figure 2.
Effects of exercise on the performance of mice in the Morris water maze test.
(A) Mean latency in the hidden platform test after training. (B) The number of platform crossings in 3 hours. (C) The mean swimming distance on day 6 in each group. (D) The mean swimming speed on day 6. All data are reported as the mean ± SEM. One-way analysis of variance or unpaired Student's t-test was used for statistical analyses. *P < 0.05. ECA: Aging model groups with exercise; SECA: aging model group without exercise; ECN: normal control group with exercise; SECN: normal control group without exercise.

