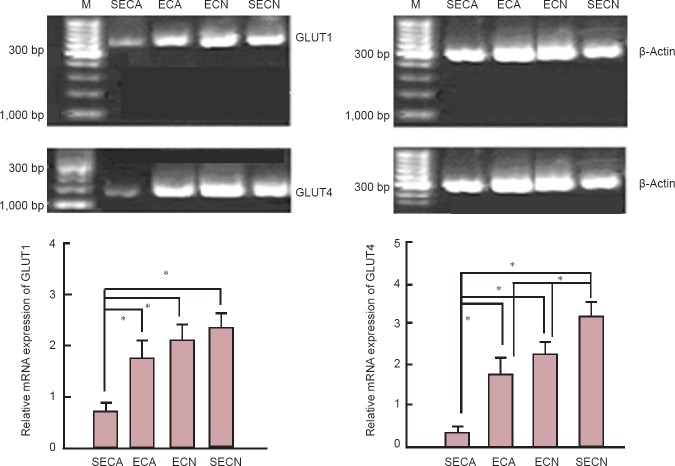
Figure 6.
Influence of exercise on GLUT1 and GLUT4 mRNA expression in the aging mouse brain (quantitative real-time PCR).
The expression of GLUT1 and GLUT4 mRNA was expressed as the optical density ratio of GLUT1 and GLUT4 mRNA to β-actin. Data are presented as the mean ± SEM, derived from a minimum of two separate cell preparations. One-way analysis of variance or unpaired Student's t-test was used for statistical analyses. *P < 0.05. ECA: Aging model group with exercise; SECA: aging model group without exercise; ECN: normal control group with exercise; SECN: normal control group without exercise; GLUT1: glucose transporter-1; GLUT4: glucose transporter-4; M: marker.

