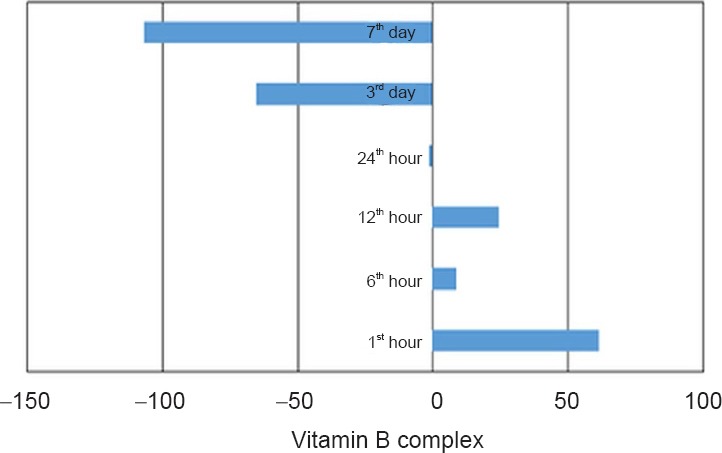
Figure 2.

Deviation of vitamin B complex level in the study groups from that in the control group.
Data were expressed as the mean ± standard deviation.

Deviation of vitamin B complex level in the study groups from that in the control group.
Data were expressed as the mean ± standard deviation.