Figure 3.
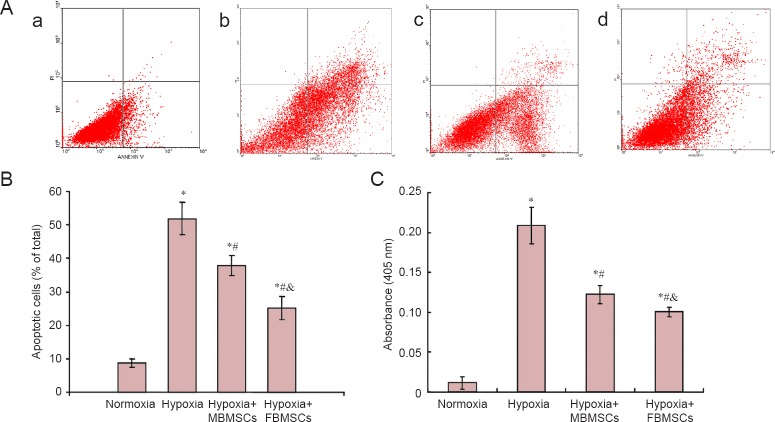
Co-culture effect of MBMSCs and FBMSCs on hypoxia-induced apoptosis of RGCs and caspase-3 activity.
RGCs were cultured alone under normoxia or hypoxia (normoxia, hypoxia groups) or co-cultured with MBMSCs and FBMSCs under hypoxic conditions (hypoxia + MBMSCs, hypoxia + FBMSCs groups). (A) Annexin V-FITC/PI staining by flow cytometry. A control normoxic culture is shown in (a). Cells were exposed to hypoxia (b) for 24 hours either alone or co-cultured with MBMSCs (c) or FBMSCs (d). Annexin V+/PI− (Q3) demonstrates early apoptotic cells, and Annexin V+/PI+ (Q2) demonstrates late apoptotic cells. (B) Quantitative analysis of the percentage of apoptotic cells calculated using the FACScan flow cytometer. Apoptotic cells include early (Q3) and late (Q2) cells. *P < 0.05, vs. normoxia group; #P < 0.05, vs. hypoxia group, &P < 0.05, vs. hypoxia + MBMSC group. (C) Caspase-3 activity was measured by cleavage of the caspase-3 substrate, acetyl-Asp-Glu-Val-Asp p-nitroanilide. (B, C) Data are shown as the mean ± SD (n = 3; one-way analysis of variance and the least significant difference test). *P < 0.05, vs. normoxia group; #P < 0.05, vs. hypoxia group, &P < 0.05; vs. hypoxia + MBMSCs group. BMSCs: Bone marrow mesenchymal stem cells; MBMSCs: male bone marrow mesenchymal stem cells; FBMSCs: female bone marrow mesenchymal stem cells; RGCs: retinal ganglion cells; FITC: fluorescein isothiocyanate; PI: propidium iodide.

