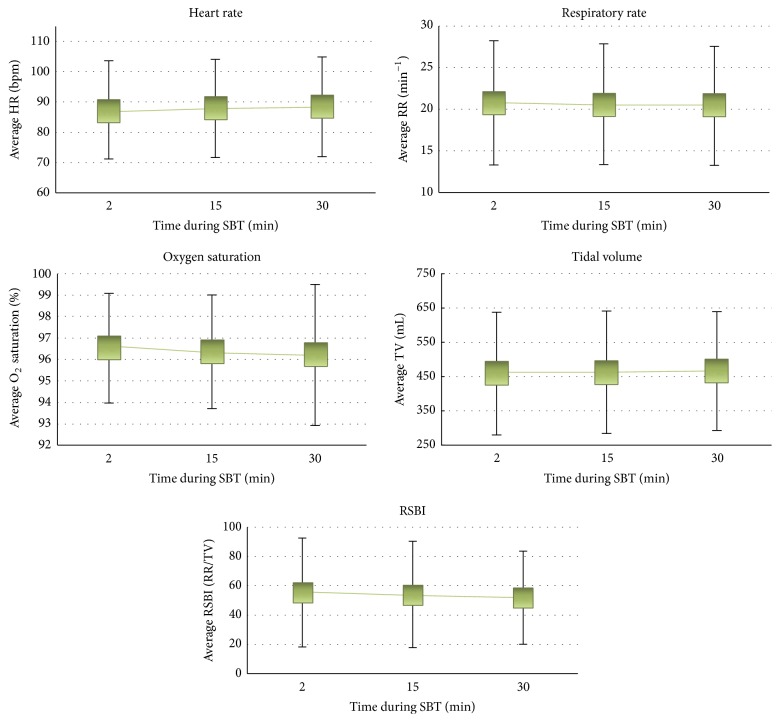
Figure 4.
Average physiological variables (heart rate [HR], beats/min; respiratory rate [RR], breaths/min; tidal volume [TV], mL; O2 saturation, %) and rapid shallow breathing index (RSBI), RR/TV. This series of figures depict the change in average physiological variable over three time points (2 min, 15 min, and 30 min). Averages were calculated across all spontaneous breathing trials (SBTs) with available data at each time point. Error bars represent 1 standard deviation.

