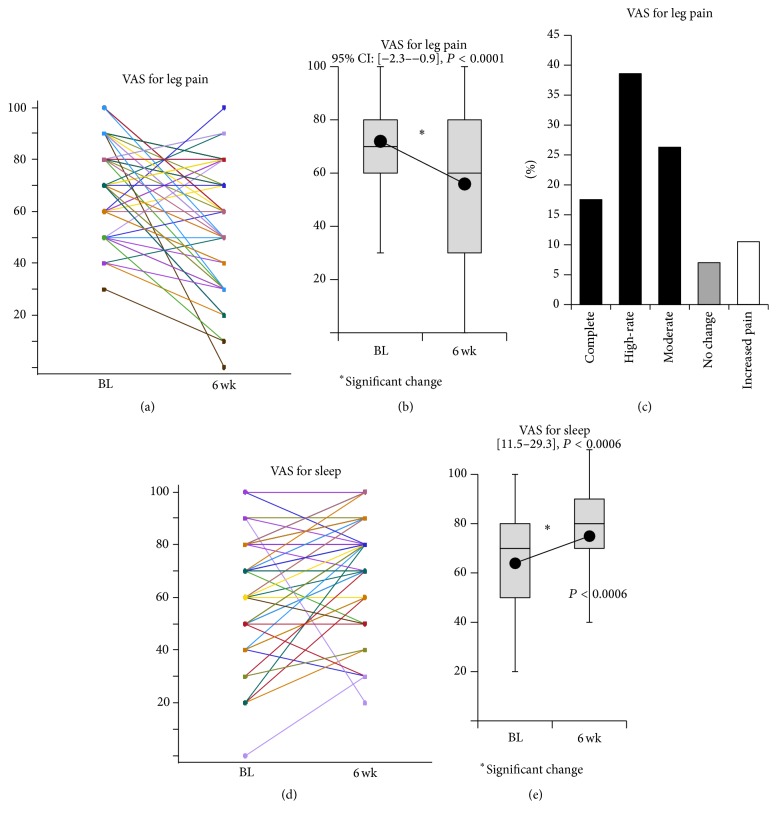
Figure 3.
Visual analog scale (VAS) scores. (a, b, and c) Leg pain; raw data, followed by box and whisker plot. (d, e) Sleep quality; box and whisker plot. The average score at each time point is connected to indicate the tendency for change. Both scores are significantly decreased after the 6-week administration of pregabalin (PGB).

