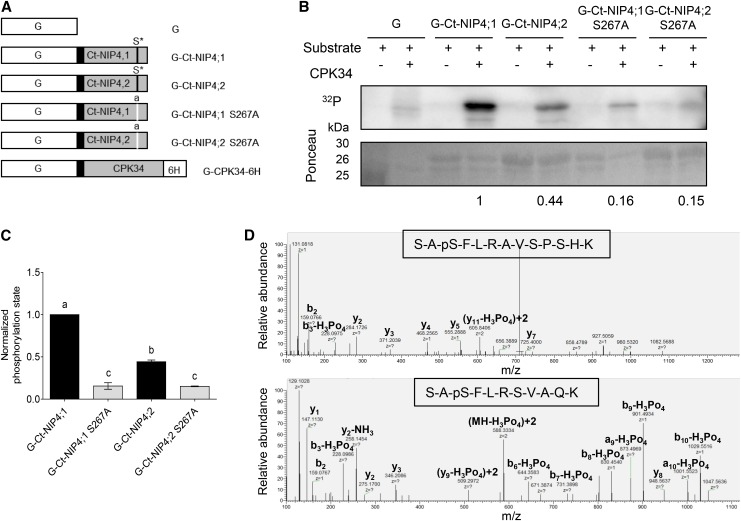
Figure 11.
Phosphorylation of NIP4;1 and NIP4;2 C-Terminal Domains.
(A) Diagram of the GST fusion proteins used for analysis of CPK phosphorylation sites of the NIP4;1 and NIP4;2 C-terminal domains. pGEX-6P-1 vectors expressing GST (G, white boxes) or GST fused to wild-type NIP4 or mutated NIP4-S267A C-terminal domains (Ct-NIP, gray boxes), linked by a PreScission protease site (black boxes). Asterisk labeled S* residue indicates wild-type phosphorylation site; lowercase “a” indicates an S-to-A substitution at position 267 (S267A) by site-directed mutagenesis of nucleotide T at position 799 to G (t799g). pGEX-4T vector expressing CDPK34 located between N-terminal GST and a C-terminal 6 His tag (6H; kindly provided by J.F. Harper).
(B) Kinase reactions showing in vitro phosphorylation of GST only (G), G-Ct-NIP4;1, G-Ct-NIP4;2, G-Ct-NIP4;1-S267A, and G-Ct-NIP4;2-S267A C-terminal fusion proteins. Autoradiogram of stained gel showing proteins labeled by 32P-phosphorylation. Ponceau-stained gel showing relative loading amounts of substrates for each kinase reaction. Results shown are representative of three independent analyses. Note that the purified G-Ct-NIP4s and G-Ct-NIP4s S267A fusion proteins run as two bands corresponding to full-length fusion protein (30 kD) and GST (26 kD), respectively. The 25-kD band in the first row corresponds to the protein marker.
(C) Relative phosphorylation levels were normalized to the amount of Ponceau-stained protein for each substrate calculated by densitometry, and the background phosphorylation level of GST was subtracted from each sample. Results shown are the average of three independent analyses for each variant. Error bars show se. Different letters indicate statistically significant differences (P < 0.05, one-way ANOVA, Tukey’s test).
(D) Mass spectra of NIP4;1 and NIP4;2 S267-phosphorylated peptides. A loss of 98 D (H3PO4) is observed only for the Ser-267 residue.

