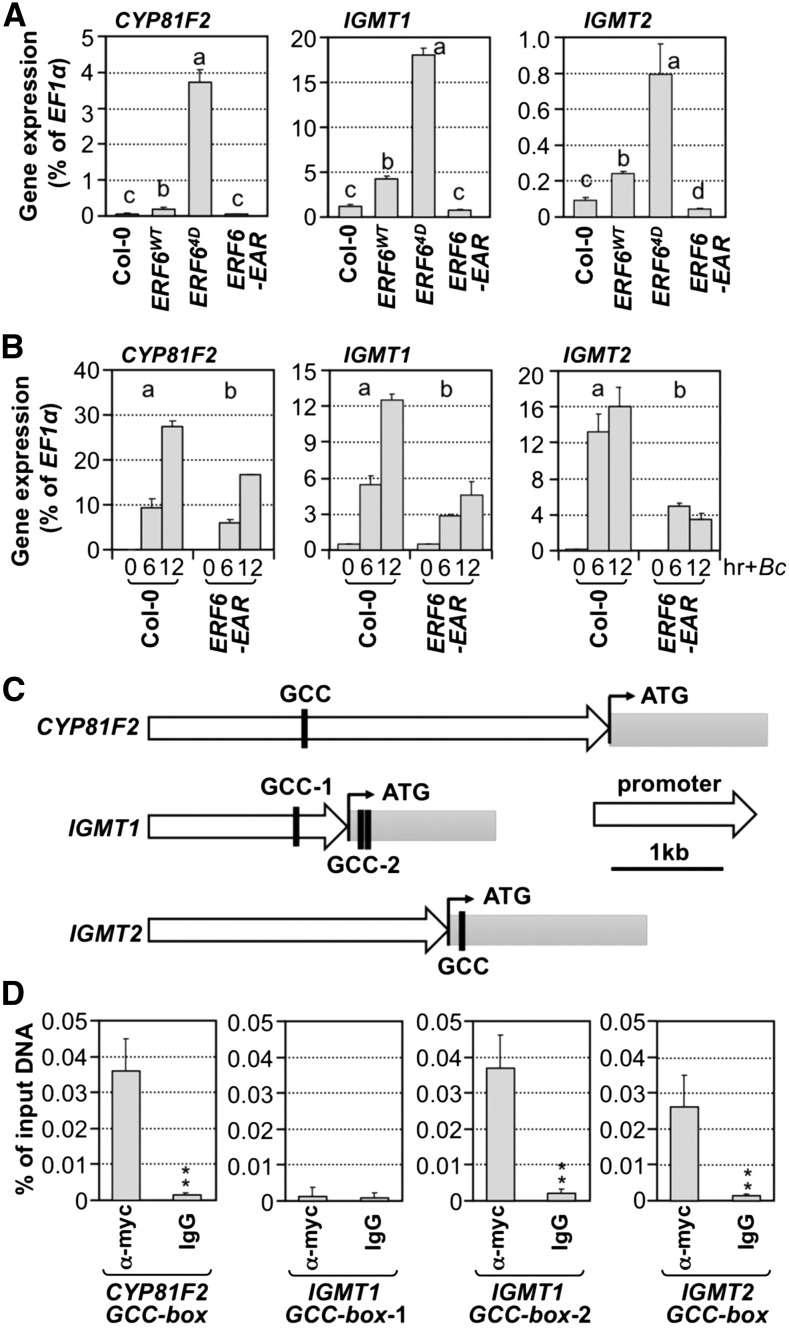
Figure 11.
ERF6 Regulates the Expression of CYP81F2, IGMT1, and IGMT2 by Directly Interacting with Their Promoters.
(A) Gene expression of CYP81F2, IGMT1, and IGMT2 in 12-d-old Col-0, 35S:ERF6WT, 35S:ERF64D, and 35S:ERF6-EAR seedlings was quantified by RT-qPCR and calculated as percentages of the EF1α transcript. One-way ANOVA was used to compare gene expression in different genotypes (P < 0.05).
(B) Gene expression of CYP81F2, IGMT1, and IGMT2 in 12-d-old Col-0 and 35S:ERF6-EAR seedlings after B. cinerea (Bc) inoculation. Samples were collected without treatment (A) or at indicated times after treatment (B) for total RNA preparation. The transcript levels were determined by RT-qPCR and calculated as percentages of the EF1α transcript. Error bars indicate sd (n = 3). Gene expression in different genotypes was analyzed by two-way ANOVA. Different lowercase letters above the columns indicate statistically different groups (P < 0.01).
(C) Diagrams showing the GCC boxes in the genomic sequences of CYP81F2, IGMT1, and IGMT2 genes.
(D) ERF64D binds to the GCC-boxes in CYP81F2, IGMT1, and IGMT2 genes in vivo. ChIP-qPCR was performed using 12-d-old 35S:ERF64D seedlings. Tagged 4myc-ERF64D protein-chromatin complex was immunoprecipitated with an anti-myc antibody. A control reaction was processed side-by-side using mouse IgG. ChIP- and input-DNA samples were quantified by real-time qPCR using primers specific to the GCC-box-containing regions (C). The ChIP results are presented as a percentage of input DNA. Differences in DNA abundance of anti-myc and IgG antibody samples were analyzed by Student’s t test (*P < 0.05 and **P < 0.01). Error bars indicate sd (n = 3).

