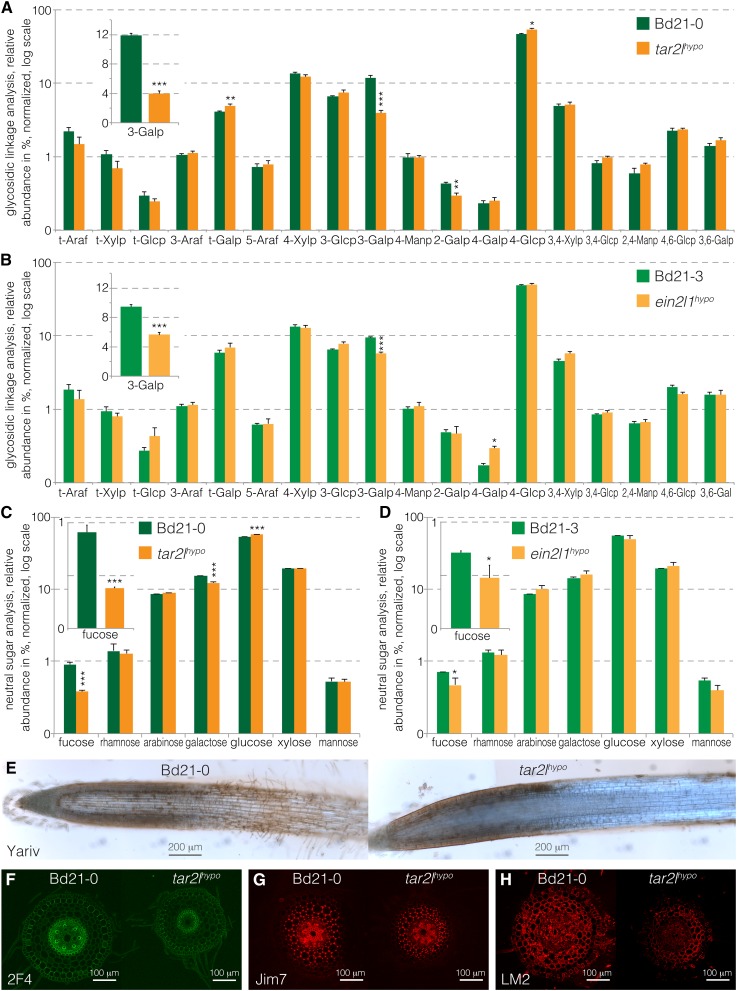
Figure 4.
Cell Wall Analyses of tar2lhypo and ein2l1hypo Root Segments Compared with Their Wild-Type Backgrounds.
(A) Glycosidic linkage analysis of Bd21-0 and tar2lhypo root segments.
(B) Glycosidic linkage analysis of Bd21-3 and ein2l1hypo root segments.
(C) Neutral sugar analysis of Bd21-0 and tar2lhypo root segments.
(D) Neutral sugar analysis of Bd21-3 and ein2l1hypo root segments.
(E) Yariv staining (brownish) against β-1,3-galactan linkages in AGPs on longitudinal sections of Bd21-0 and tar2lhypo root tips.
(F) 2F4 antibody staining against demethylesterified pectin (green) on transverse sections from the elongation zone of Bd21-0 and tar2lhypo root tips.
(G) JIM7 antibody staining against methylesterified pectin (red) on transverse sections from the elongation zone of Bd21-0 and tar2lhypo root tips.
(H) LM2 antibody staining against AGP side chains (red) on transverse sections from the elongation zone of Bd21-0 and tar2lhypo root tips. Error bars indicate se of the mean (two technical replicates per each of three biological replicates). Differences were not statistically significant (Student’s t test) unless indicated as follows: *P < 0.05, **P < 0.01, and ***P < 0.001.

