Figure 1.
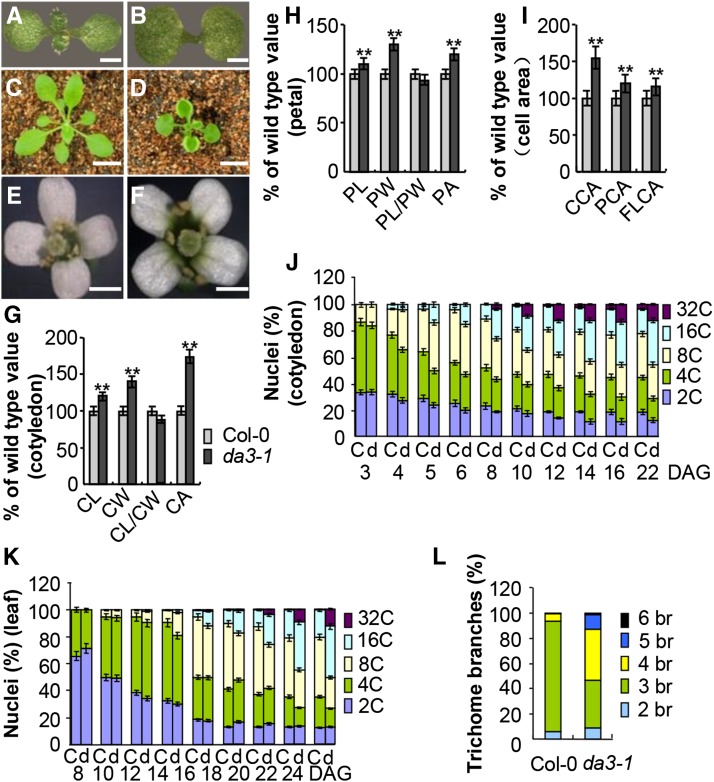
da3-1 Influences Endoreduplication and Cell and Organ Growth.
(A) and (B) Eight-day-old seedlings of Col-0 (A) and da3-1(B).
(C) and (D) Twenty-four-day-old seedlings of Col-0 (C) and da3-1(D).
(E) and (F) Flowers of Col-0 (E) and da3-1(F).
(G) Cotyledon length (CL), cotyledon width (CW), cotyledon length/cotyledon width, and cotyledon area (CA) of 10-d-old Col-0 and da3-1 seedlings (n = 60).
(H) Petal length (PL), petal width (PW), petal length/petal width, and petal area (PA) of Col-0 and da3-1 flowers (stage 14) (n = 50).
(I) The average area of cells in cotyledons (CCA) of 10-d-old Col-0 and da3-1 seedlings, petals (PCA) (stage 14), and the first pair of leaves (FLCA) of 21-d-old Col-0 and da3-1 seedlings . Thirty-five cotyledons (n = 35), thirty-five petals (n = 35), and thirty leaves (n = 30) were used to measure cell area.
(J) Nuclear DNA ploidy distribution of cells in Col-0 (C) and da3-1(D) cotyledons over a period of 22 DAG (n = 3). Cotyledons were harvested at the indicated times and ploidy was determined by flow cytometry.
(K) Nuclear DNA ploidy distribution of cells in the first pair of leaves of Col-0 (C) and da3-1(D) seedlings over a period of 24 DAG (n = 3). The first pair of leaves was harvested at the indicated times and ploidy was determined by flow cytometry.
(L)Trichome branch (br) distribution of Col-0 and da3-1 in the first pair of leaves of seedlings at 15 DAG (n = 200).
Values in (G) to (K) are given as means ± sd relative to the values for the respective wild-type seedlings, set at 100%. **P < 0.01 compared with the wild type (Student’s t test).
Bars =1 mm in (A) and (B), 2 cm in (C) and (D), and 1 mm in (E) and (F).

