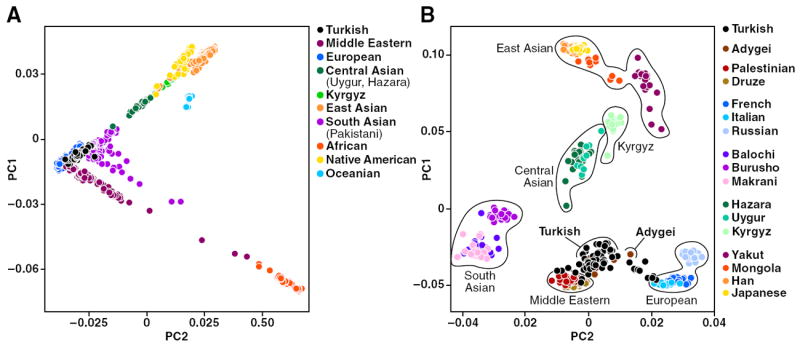
Figure 2.

PC analysis demonstrating genetic relatedness across major geographic regions, including HGDP, Turkish, and Kyrgyz samples. Each symbol represents one individual. (A) PC analysis of 52 populations from the HGDP (n = 938), Turkish (n = 63), and Kyrgyz (n = 16) samples. (B) PC analysis focusing on selected Eurasian populations (including Turkish and Kyrgyz populations) (n = 451).
