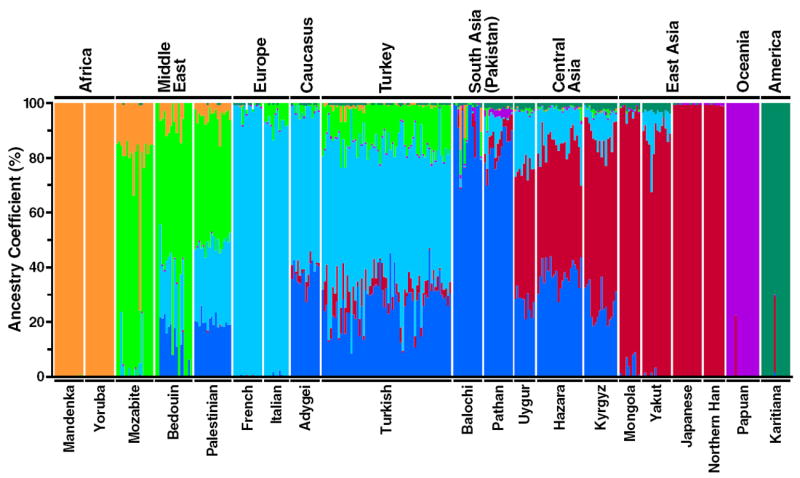
Figure 4.

Estimated individual ancestry and population structure in 339 individuals by FRAPPE analysis. Representative HGDP populations selected from all continental/geographical regions and combined with Turkish and Kyrgyz samples (n = 339). Populations are labeled above the figure, with their geographic affiliations below. Each individual is represented by a thin vertical line, which is partitioned into K colored segments (K = 7). Colors represent the inferred ancestry from parental populations. White lines separate individuals of different populations.
