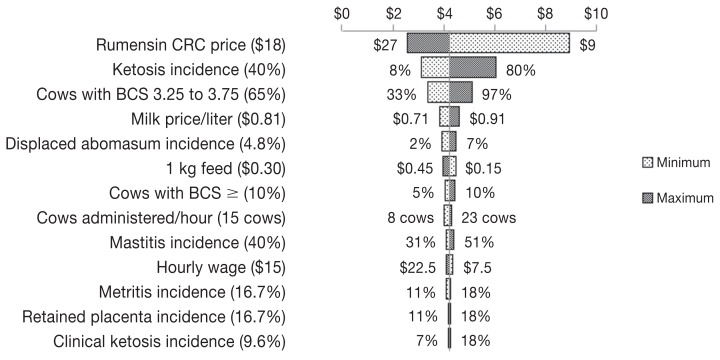
Figure 1.
A Tornado plot depicting the change in the return on investment after using Rumensin controlled release capsule (CRC) in Canada. Values in parentheses are baseline values used in building the model, while values on the sides of the bars are the minimum and maximum values used for sensitivity analysis. The line in the middle of the plot separating minimum and maximum bars represents the return on investment (indicated by $3.95 of return for $1 invested) resulting from using the baseline values of different inputs.

