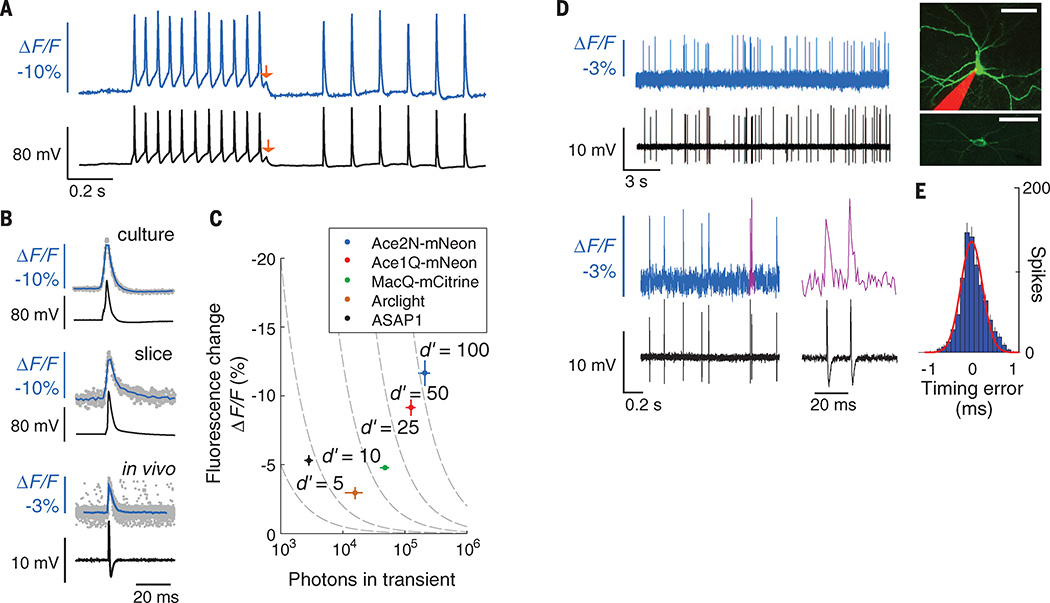
Fig. 2. Ace sensors provide about threefold to tenfold better spike detection fidelity (d′) than previous GEVIs.
(A) Fluorescence signals from cultured neurons expressing Ace2N-mNeon (blue trace) had sharp peaks closely matching action potentials in concurrent electrophysiological recordings (black trace). Red arrows mark a ~5 mV depolarization apparent in both traces. (B) Optical and electrical waveforms of single action potentials in example neurons expressing Ace2N-mNeon in cell culture (top), Ace2N-mNeon in mouse brain slice (middle), and Ace2N-4AA-mNeon in anesthetized mouse brain (bottom). Data (gray points) acquired optically from different spikes were temporally aligned to the corresponding peaks in the electrical traces. Mean waveforms of the optical data (blue traces; averaged over N = 30 spikes; resampled to 2 kHz) are aligned with the mean electrical waveforms (black traces; whole-cell patch recordings for cells in culture and brain slice; loose patch recording for live mouse). (C) Peak ΔF/F responses to action potentials, as a function of the total number of photons detected per spike in cultured neurons. Isocontours (dashed lines) of spike-detection fidelity, d′, were determined from measured brightness and optical waveforms, as in (B). Error bars, SEM. (D) Concurrent optical (colored) and juxtacellular electrical (black) recordings in an anesthetized mouse from V1 cells expressing Ace2N-4AA-mNeon. Magenta trace (lower right) shows the two magenta spikes in adjacent trace. Across 837 spikes, the electrical and optical traces were in perfect accord. (Inset) Two different neocortical neurons imaged by two-photon microscopy. A maximum projection of a dual-color image stack (top) acquired in a live mouse shows an Ace2N-4AA-mNeon–labeled cell and a pipette, filled with red dye, that recorded somatic electrical activity. An image acquired in a brain slice (bottom) after in vivo experimentation shows the membrane localization of Ace2N-4AA-mNeon. Scale bars, 40 µm. (E) Histogram of timing errors for spikes detected optically as in (D), using the electrical trace to provide the actual spike time (N = 837 spikes from three cells). Red line, Gaussian fit. Error bars, SD, estimated as counting errors. Illumination: 15, 25, and 25 mW · mm−2, respectively, for studies in culture, brain slice, and live mice. Image acquisition rates: 440 Hz, 440 Hz, and 1000 Hz, respectively.

