
Figure 3.
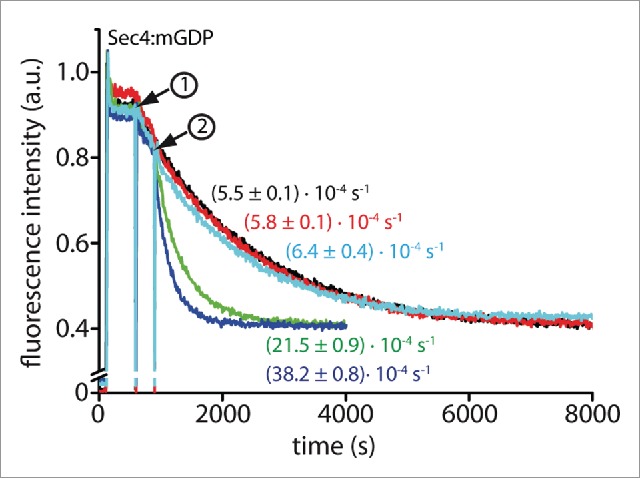
Nucleotide exchange assay using proteins from cell free expression. Sec4:mantGDP (1 µM) was incubated with 200 µM GDP (step 1) without addition of cell-free expressed protein showing the intrinsic rate of nucleotide exchange (black curve) and after addition (step 2) of 20 µl cell-free expression mixture (red curve) as control experiments. These experiments show that the cell-free expression mixture does not contain factors that accelerate nucleotide exchange. Additionally, similar experiments were repeated after expression of the putative targets (green and blue curves: 10 µl and 20 µl cell free expression mixture after expression of Sec2, respectively; cyan: 20 µl cell free expression mixture after expression of Dss4). Observed rate constants are indicated for each curve.