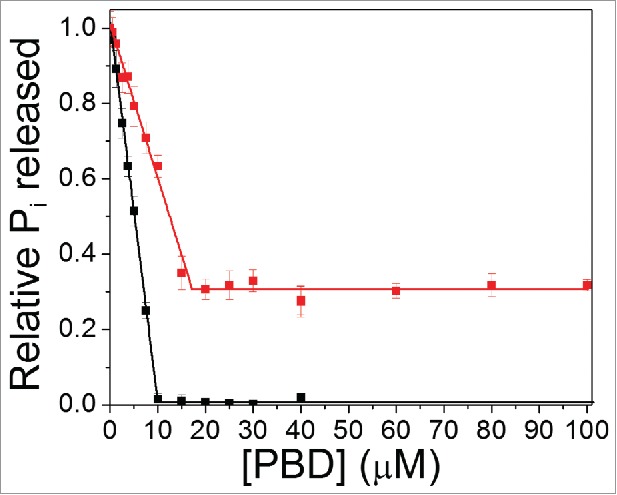
Figure 1.

Intrinsic GTP hydrolysis is observed for Cdc42(T35A) in the presence of PBD46. Plot of inorganic phosphate released (Pi) over 30 minutes stimulated by wt Cdc42 (Black line) relative to Cdc42T35A) (Red line) as a function of increasing PBD46 concentration.
