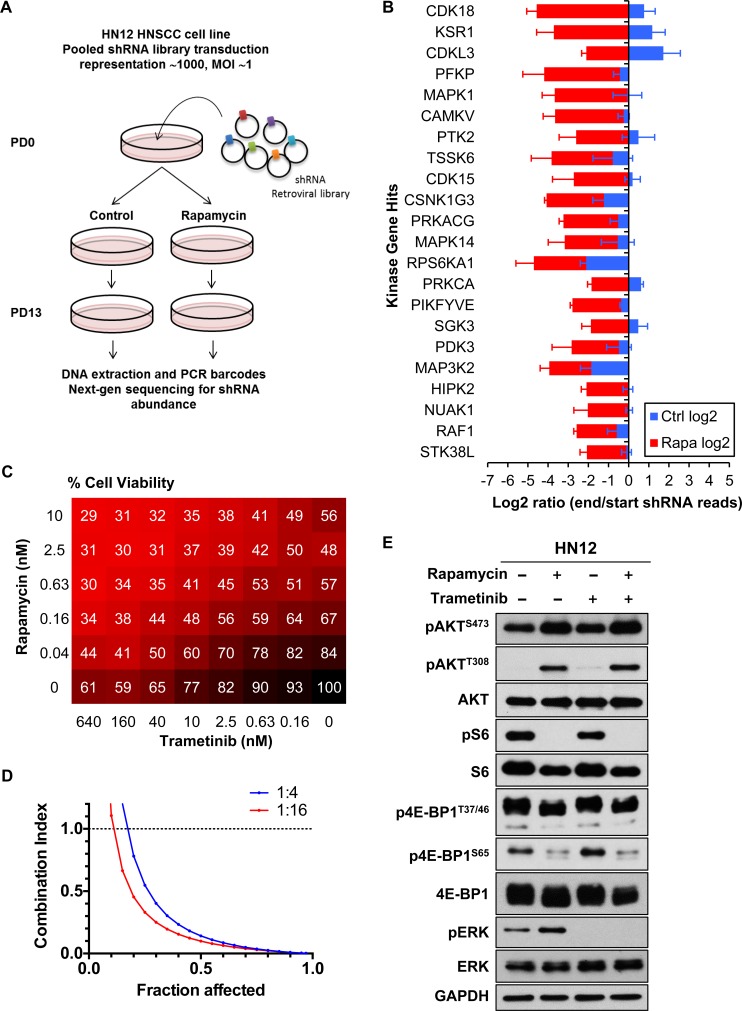
Figure 1. RNAi synthetic lethal screen.
A. Schema of shRNA screen. The change in the relative abundance of each shRNA in the library over time is measured using the normalized PD 13/PD 0 ratio of its reads. A log2 PD 13/PD 0 ratio of < 0 indicates the shRNA is depleted in the population over time, and a log2 PD 13/PD 0 ratio of < 0 indicates the shRNA is enriched in the population. B. Hit kinase genes. Targets were filtered by log2 PD 13/PD 0 ratio of < −2 (n = 3). C. Factorial dose matrix combinatorial drug treatment. HN12 cells were incubated for 72 hrs with indicated concentrations of drugs. Numbers on the matrix indicate % Cell Viability (n = 3). D. Computer-simulated Fa-CI curves were created based on the matrix data. The ratios of rapamycin : trametinib were indicated. Synergism (CI < 1), additive effect (CI = 1), or antagonism (CI > 1) for the indicated levels of growth inhibition (Fraction affected) induced by the drug combination. E. mTOR/ERK pathway. HN12 cells were treated with 0.1% DMSO, 20nM rapamycin, 20nM trametinib or the combination for 24hrs.

