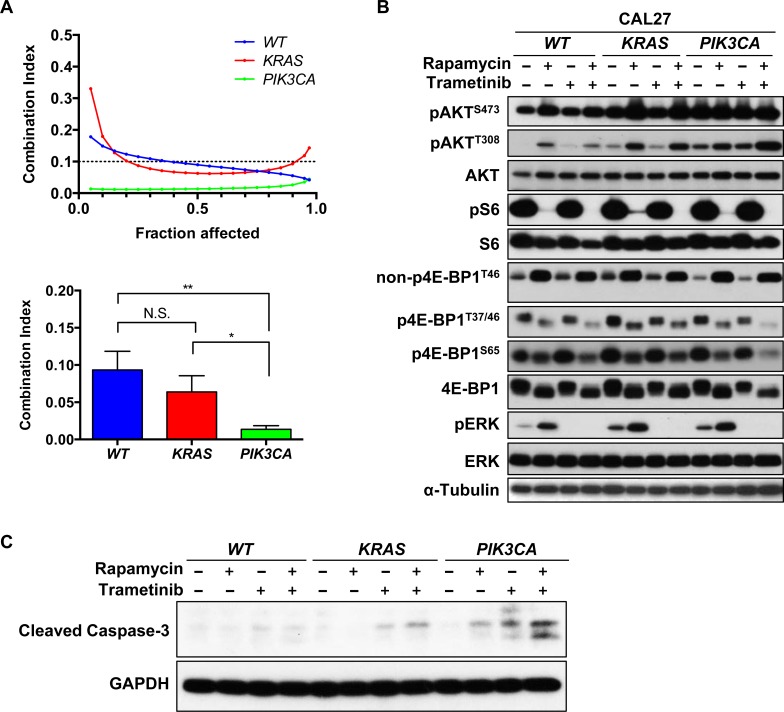
Figure 5. Synergism of rapamycin and trametinib in genetically engineered HNSCC cells to express activating KRAS or PIK3CA mutations.
A. Computer-simulated Fa-CI curves were created based on the factorial dose matrix combinatorial drug treatment. The ratios of rapamycin : trametinib were 1:16. Synergism (CI < 1), additive effect (CI = 1), or antagonism (CI > 1) for the indicated levels of growth inhibition (Fraction affected) induced by the drug combination (left). CI values at Fa = 0.5 was used to calculate the mean between experiments (n = 3). *P < 0.05, **P < 0.01. B. mTOR/ERK signaling pathway. Cells were treated with 0.1% DMSO, 20nM rapamycin, 20nM trametinib or the combination for 0.5h or 24hrs. C. Immunoblot analysis for cleaved-caspase 3. Cells were treated with 0.1% DMSO, 20nM rapamycin, 20nM trametinib or the combination for 24hrs.

