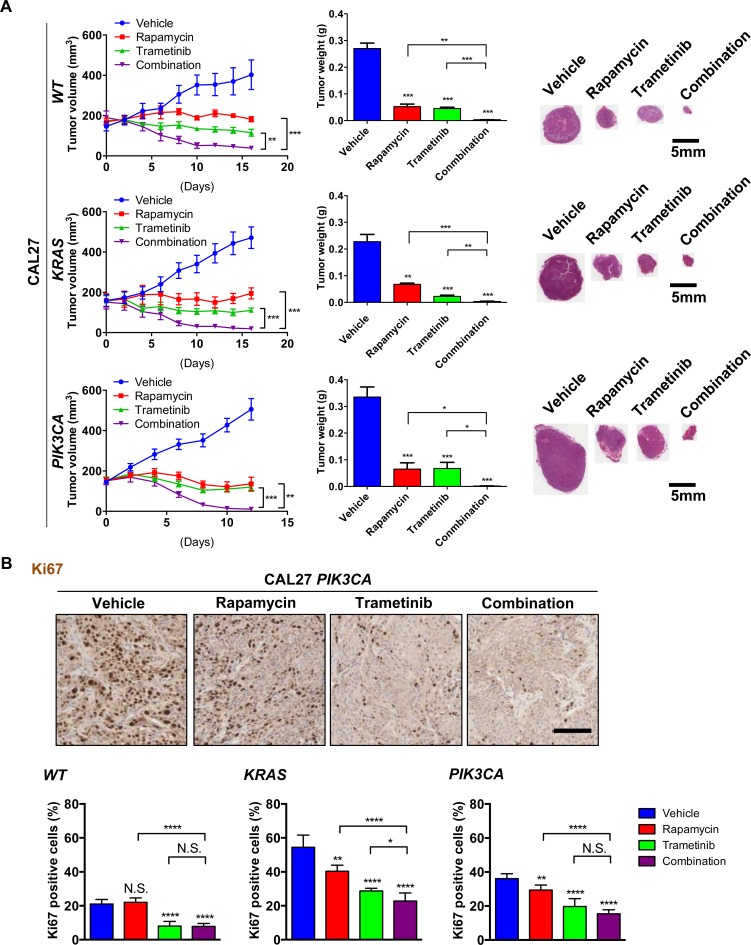
Figure 6. Antitumoral activity of the rapamycin and trametinib combination therapy against genetically engineered HNSCC cells expressing KRAS and PIK3CA oncogenes.
A. Antitumor efficacy of rapamycin, trametinib, and combination. Athymic nude mice were transplanted with HNSCC cells. Treatment was initiated when the tumor volume reached approximately 200 mm3. The tumor growth curves (left), tumor weights at the end of the single agent and combined treatments (middle) and representative histological sections for each treatment group. Scale bars represent 5 mm (right) are displayed. Data points represent mean values ± SE (n = 10 per each group). B. Representative tumor tissue sections (top) and quantification (bottom) stained for Ki67 (n = 6 per each group). Scale bars represent 100 μm. *P < 0.05, **P < 0.01, ***P < 0.001.

