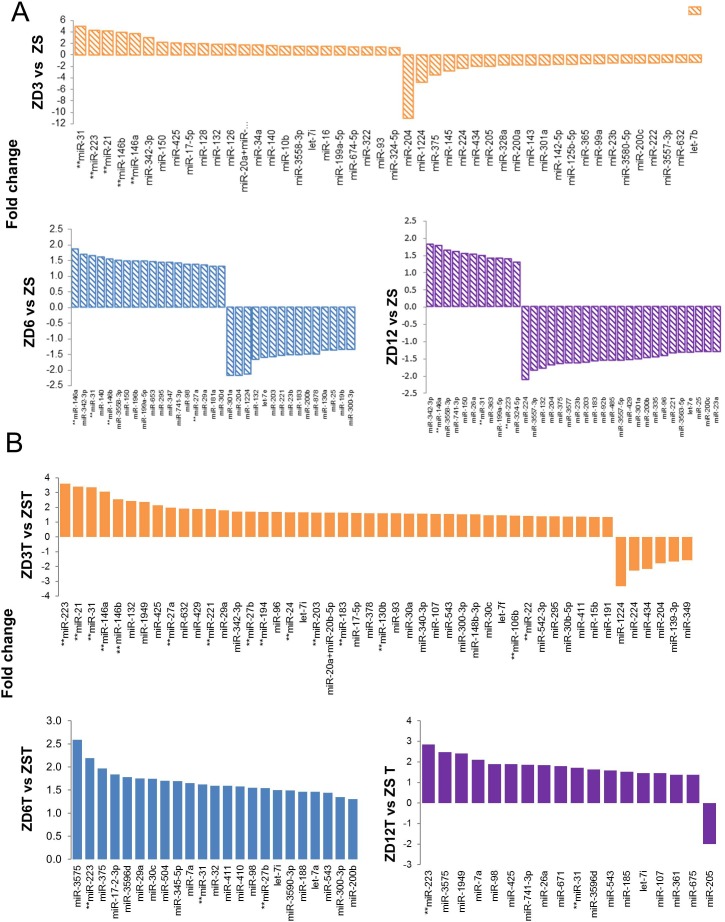
Figure 3. Esophageal microRNA expression profiling in Zn modulated rats by nanoString™ nCounter rat miRNA expression assay kit.
A.–B. Barplots showing fold change of differentially expressed miRNAs in A. NMBA-untreated control esophagi at 22-weeks after dietary regimen: ZD3 vs ZS, ZD6 vs ZS, and ZD12 vs ZS group; and B. Tumor bearing esophagi from NMBA-treated rats at tumor endpoint: ZD3T vs ZST, ZD6T vs ZST, and ZD12T vs ZST. **Denotes miRNAs that are similarly up- or down-regulated in human esophageal squamous cell carcinoma. ZD3 = marked-ZD; ZD6 = moderate-ZD; ZD12 = mild-ZD; ZS = Zn-sufficient. ZD3T, ZD6T, ZD12T, and ZST represent the tumor groups (n = 6 rats/group; cut off: P ≤ 0.05, fold-change ≥ 1.3).

