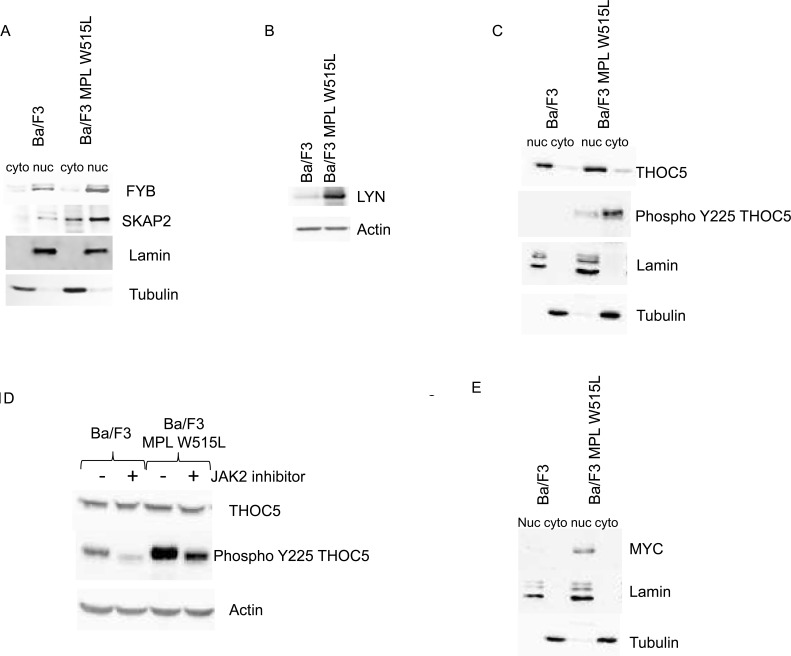
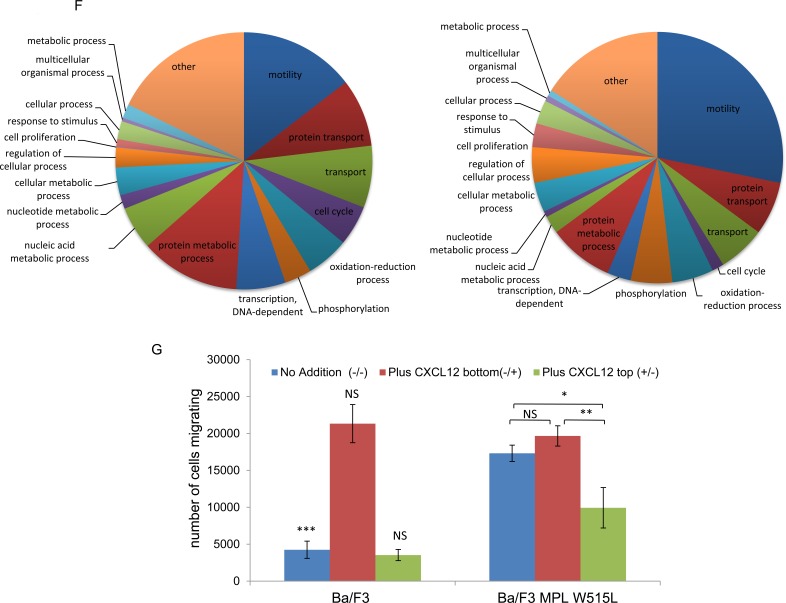
Figure 1. The effect of MPL W515L on the Nuclear and cytoplasmic proteome.
Control and MPL W515L expressing cells were subject to nuclear/cytoplasmic fractionation and the levels and distribution of the proteins indicated assessed by western blot analysis. (A, C and E). Lamin and tubulin expression were used as loading controls and fractionation markers. B. The expression level of Lyn was assessed by western blot in whole cell lysates. Actin was used as a loading control. D. Western blot analysis of THOC5 phosphorylation in control and MPL W515L expressing cells following treatment with 0.5μM of the Jak2 inhibitor Ruxolitinib for 16hours. Actin was used as a loading control. F. Pie charts of cytoplasmic proteins categorised by biological-process are shown. The left panel represents all the proteins identified (3447) with an assigned biological process and the right panel those defined as changing (131) in at least two of the three replicates. G. The CXCL12 induced chemotactic response of control and MPL W515L expressing cells was assessed in Boyden chamber assays. Cells (1×10⁵) were added to the top well. CXCL12 (200ng/ml) was added to bottom well (−/+), top well (+/−) or omitted (−/−). The number of cells in the bottom well was counted after 6 hours. Results are the mean ± SEM, n = 4. The results of a t-test between Ba/F3 and MPL W515L are shown above the results for Ba/F3 and between the treatments for the MPL W515L. The results of the t-test are represented by; NS non-significant, * < 0.05, ** < 0.01, *** < 0.001.


