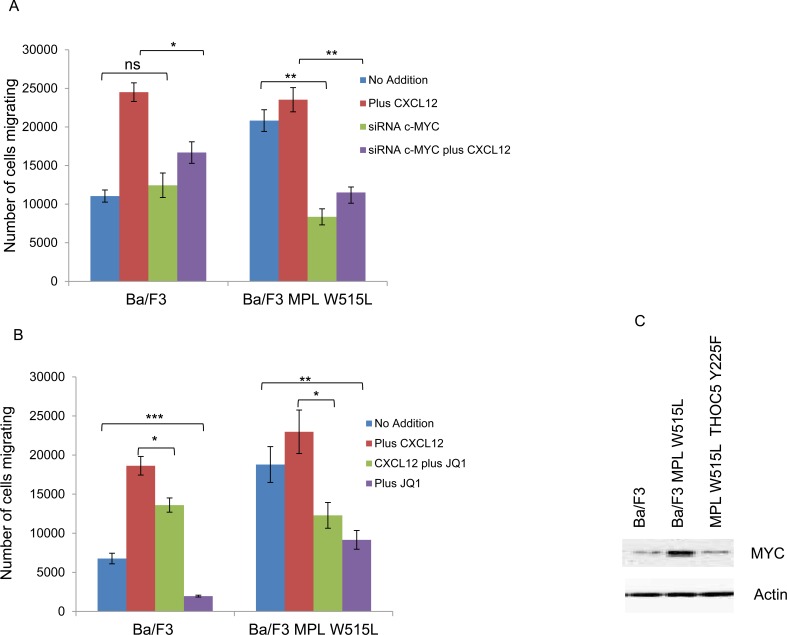
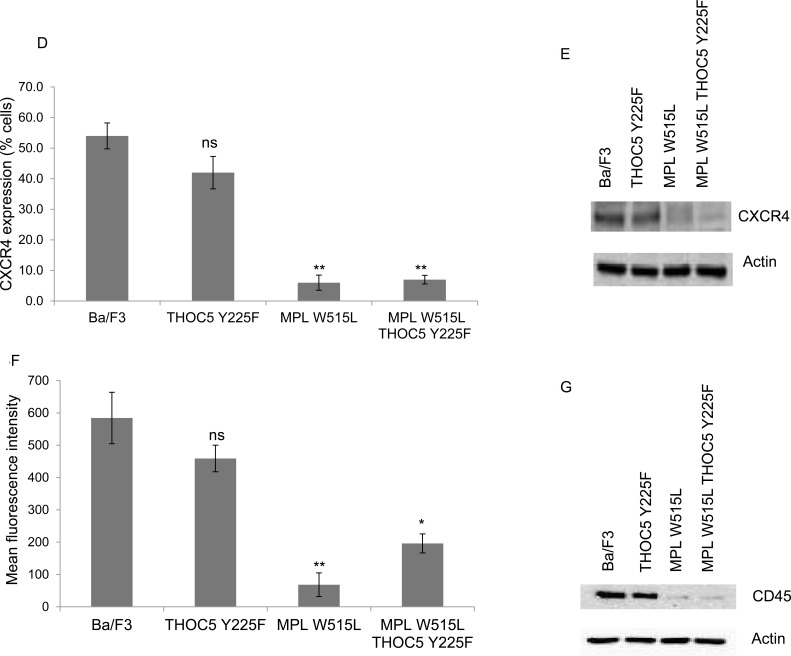
Figure 3. MYC plays a role in MPL W515L induced motility.
Chemokinesis and chemotaxis was measured using Boyden chamber assays in parental Ba/F3 cells and MPL W515L expressing cells 24 hours post transfection with c-MYC SiRNA A. or following 2 hours pre-incubation with 500nM of the MYC inhibitor JQI B. Results shown are the number of cells migrating (mean ± SEM, n = 3), cell viability was greater than 94% post migration assay. C. Western blot analysis of MYC expression with actin as a loading control. D. Cell surface expression of CXCR4 was assessed using flow cytometry. Results are expressed as the number of positively staining cells +/−SEM (n = 4). E. Western blot analysis of CXCR4 expression in whole cell lysates. Actin was used as a loading control. F. Cell surface expression of CD45 was assessed using flow cytometry. Results are expressed as the mean fluorescence intensity +/−SEM (n = 3). G. Western blot analysis of CD45 expression in whole cell lysates. Tubulin was used as a loading control. The results of a t-test against Ba/F3 (D, F) or as shown (A, B) are shown and represented by; * < 0.05, ** < 0.01, *** < 0.001.


