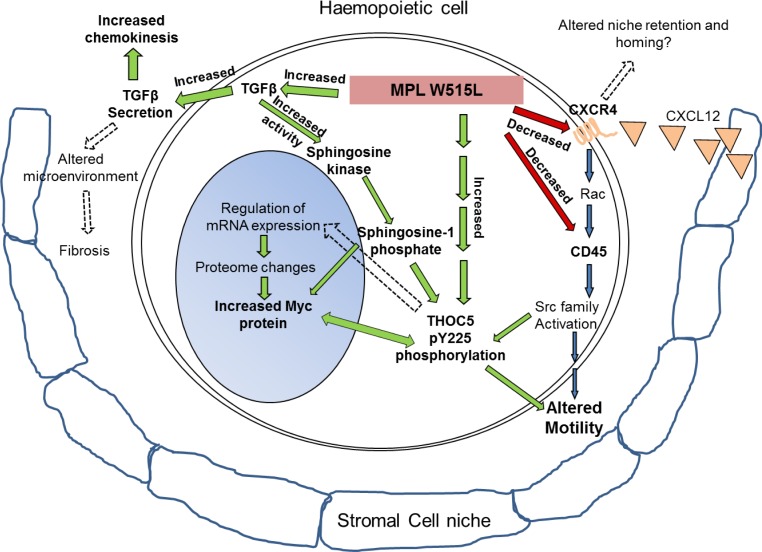
Figure 7. MPL W515L induced pathways: Schematic representation of the results depicting the MPL W515L induced protein and phenotypic changes.
Red/green arrows and bold text represent observations from this study and blue arrows and normal text recognised pathways. In addition broken arrows depict hypothesised effects.

