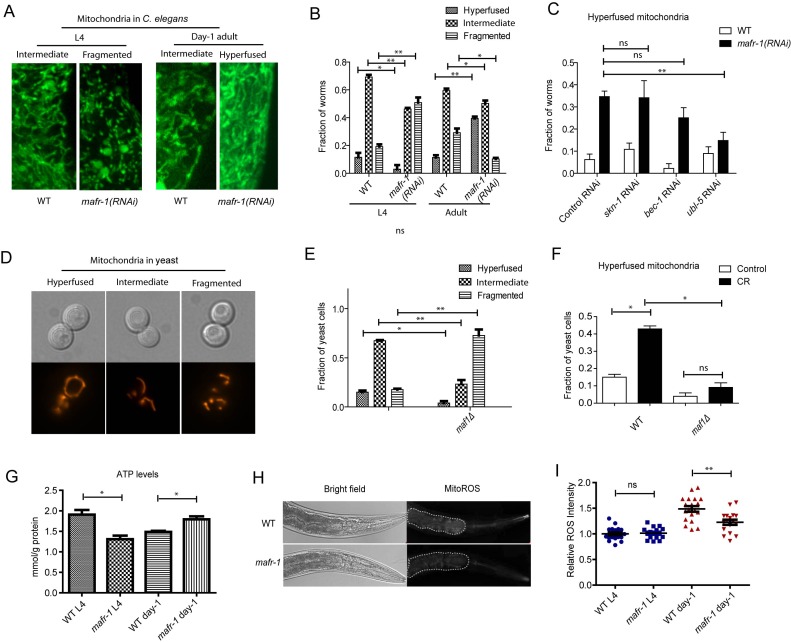
Figure 6. Mitochondria are dynamically regulated by MAFR-1/Maf1.
A. Mitochondrial morphology is dynamically changed upon loss of MAFR-1 in C. elegans. Animals expressing mitochondria-localized GFP (mito-GFP) were treated with mafr-1 RNAi from hatch and examined at L4 and adult stage. Mitochondria became fragmented at L4 stage but hyperfused at day-1 adulthood. B. Quantification of different mitochondrial morphologies as shown in A. Error bars show the SEM of 3 separate experiments. Student's t-test: **p < 0.001, *p < 0.01. C. Mitochondrial hyperfusion in mafr-1 adult worms is partially dependent on UPRmt transcriptional factor, but not oxidative stress response regulator SKN-1 or DAF-16. Indicated genes were RNAi knocked down from hatch. Error bars show the SEM of 3 separate experiments. Student's t-test: **p < 0.001, ns, not significant. D. Yeast mitochondria are dynamically changed from hyperfused structure to fragmented structure. Mitochondria were examined by mitochondria-localized RFP (mito-RFP). E. Loss of Maf1 in yeast causes fragmented mitochondria. Yeast cells in log phase (OD600 = 0.6) expressing mito-RFP was imaged and quantified for different morphology. Error bars show the SEM of 3 separate experiments. Student's t-test: **p < 0.001. *p < 0.01. F. Mitochondria hyperfusion caused by calorie restriction (CR) in yeast is partially dependent on Maf1. Yeast cells expressing mito-RFP were cultured to log phase and shifted to medium containing 2% glucose (control) or 0.2% glucose (CR) for 30 min. Fraction of yeast cells with hyperfused mitochondria was plotted. Error bars show the SEM of 3 separate experiments. Student's t-test: *p < 0.01, ns, not significant. G. MAFR-1 loss decreases ATP levels at L4 stage but increases at day-1 adulthood. Animals (n>200) were lysed and ATP concentration was determined by ATP detection kit (Invitrogen, Carlsbad, CA). Error bars show the SEM of 3 separate experiments. Student's t-test: *p < 0.01. H. ROS intensity in the intestine of WT and mafr-1 mutant worms. Worms were incubated with 10μM of ROS indicator dihyroethidium (DHE) for 30 min. The dot area indicates the anterior intestine where ROS was quantified in Figure 6I. I. Quantification of relative ROS intensity in WT and mafr-1 mutant worms at L4 and day-1 adulthood. Image J was used to quantify the DHE signal intensity of each animal and normalized to the average value of WT. Error bars show the SEM of n>20 animals, student's t-test: ns, not significant; **p < 0.001.

