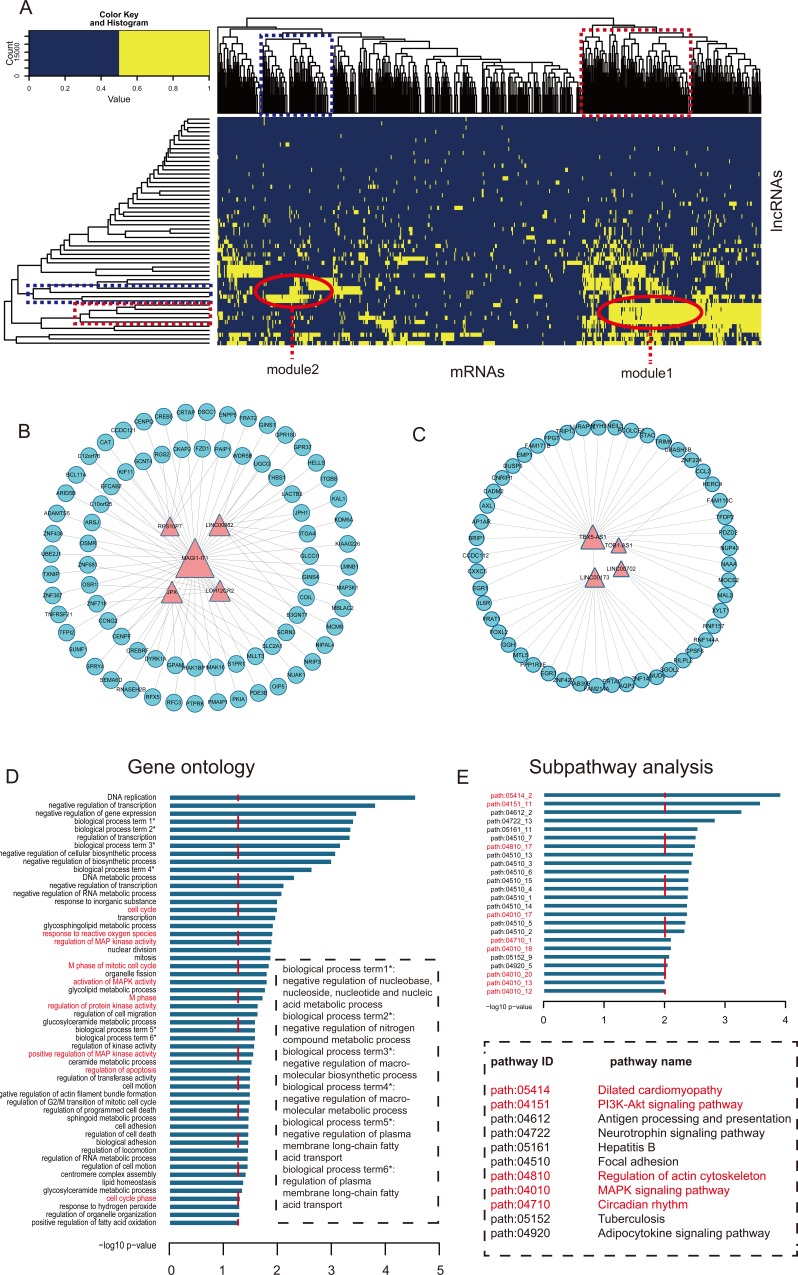
Figure 5. Module analysis of the interaction of lncRNAs and mRNAs.
A. The heat map of CHLMN. The bidirectional hierarchical cluster was performed by R package. The two red ellipses represented module 1 and module 2, respectively (The same for the rectangles in the cluster tree). B. Module 1 network extracted from CHLMN. C. Module 2 network extracted from CHLMN. D. The gene ontology (GO) enrichment analysis of module 1, x-axis were the −log10 of p-value and we thought p < 0.05 was the statistical significant. Y-axis was the names of biological processes, the whole name of the label with * showed in the dotted box and the names with red were the CH high related biological processes. E. Subpathway enrichment analysis of the module 1, x-axis were the −log10 of p-value and we thought p < 0.01 was the statistical significant. Y-axis was the names of subpathway, the pathway names were showed in the dotted box and the names with red were the CH high related subpathways.

