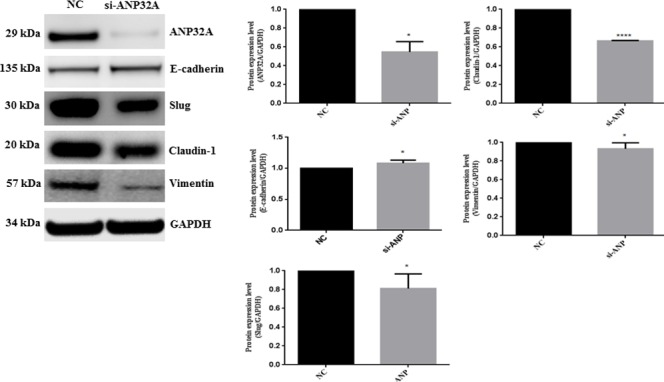
Figure 4. Knock down of endogenous ANP32A expression altered EMT proteins- E-cadherin, Slug, Claudlin-1 and Vimentin expression.

GAPDH was used as a loading control. Densitometry values are represented in bar chart. Data mean values ± SD. The asterisks indicate a significant (*, P < 0.05, **P < 0.01) difference between the si Control (siCtrl) and si-ANP32A treated groups.
