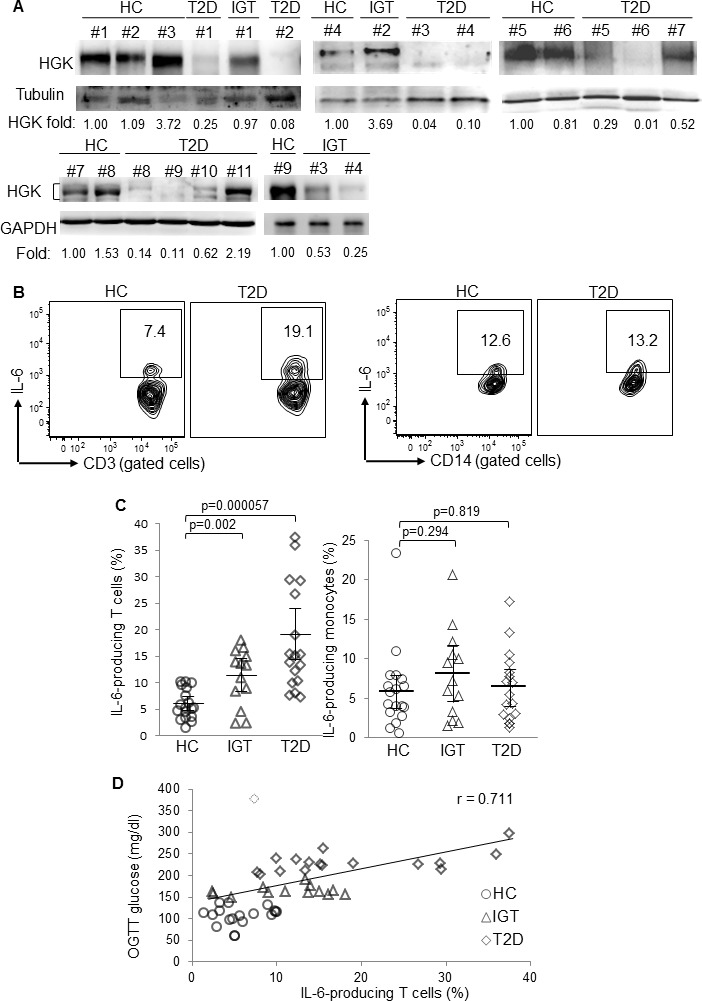
Figure 1. Downregulation of HGK and overproduction of IL-6 in peripheral blood T cells of T2D patients.

A. Immunoblotting analyses of indicated molecules in purified T cells from peripheral blood of HC (#1 to #9), IGT (#1 and #4), and T2D (#1 to #11). Relative fold changes of HGK were normalized to tubulin/GAPDH levels and are shown at the bottom of the figure. B. Flow cytometry analyses of IL-6-producing CD3+ T cells (left panel) and CD14+ monocytes (right panel) from peripheral blood of 18 healthy controls (HC), 13 impaired glucose tolerance (IGT), and 17 T2D patients; results from a T2D patient and a healthy control are shown as representative. C. Individual frequencies of IL-6-producing T cells (left panel) and monocytes (right panel) in three groups are shown. Bars denote mean ± 95% confidence interval. D. The correlation study between the frequency of IL-6-producing T cells and glucose levels after OGTT from 48 subjects. Linear regression: Y = 107.73 + 4.7992X, regression correlation coefficient: adjusted R2 = 0.505, r = 0.711, P value = 2.19 × 10⁻⁸, achieved power = 0.9985. The dotted diamond denotes one outlier that showed a high residual modulus value (modulus = 220.762 > 100; standardized residual = 4.173 > 3) in univariate linear regression analyses.
