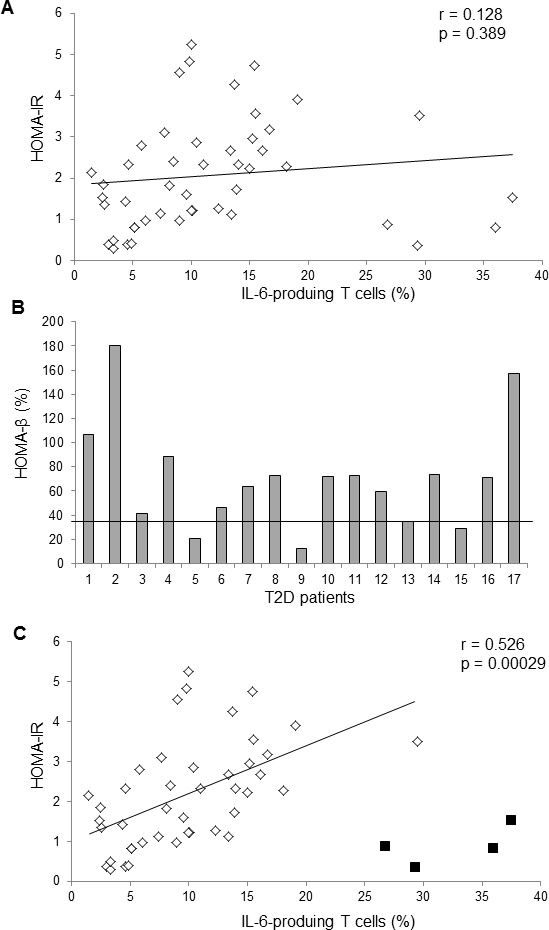
Figure 2. The frequencies of IL-6-producing T cells were correlated with HOMA-IR values.

A. The univariate linear regression analysis between the frequencies of IL-6-producing T cells and HOMA-IR values from 47 subjects. Linear regression: r = 0.128, P value = 0.398. B. Individual HOMA-β values of 13 T2D patients. C. The univariate linear regression analysis between the frequencies of IL-6-producing T cells and HOMA-IR values from 43 subjects, excluding four T2D patients' data with the lowest 25% HOMA-β values (< 35). The black squares denote four excluded T2D patients' data.
