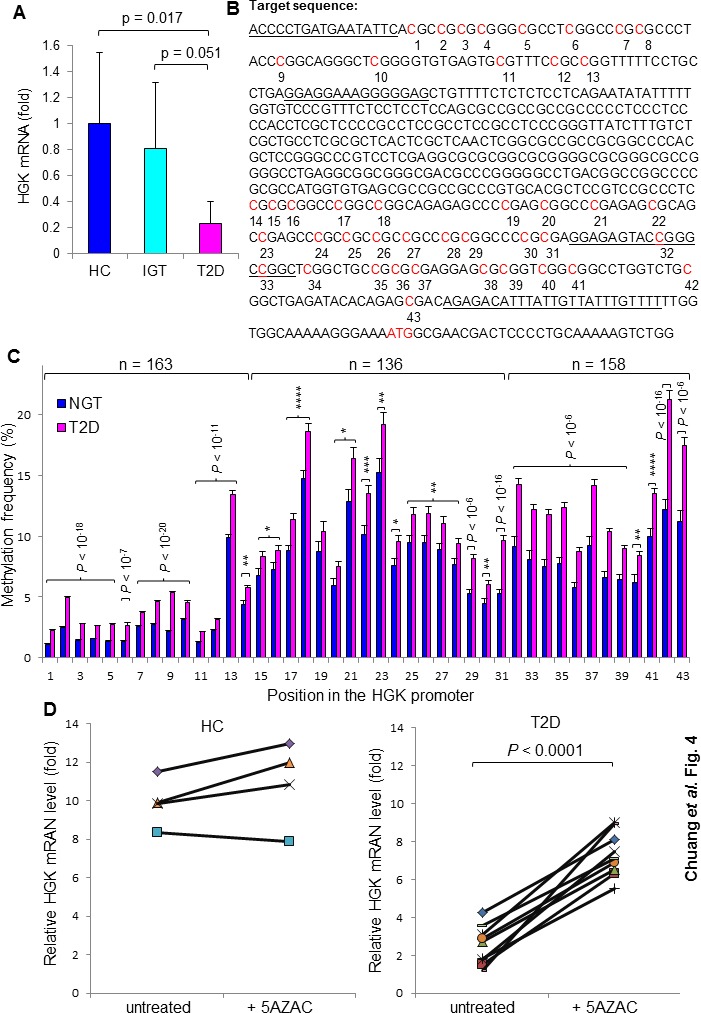
Figure 4. Enhanced methylation of the HGK promoter in T2D patients.

A. HGK mRNA levels in peripheral blood T cells from individuals (22 healthy controls and 21 patients) were analyzed by real-time PCR. Means ± 95% confidence intervals are shown. B. The position of CpG islands in the HGK promoter region. The primer location for Pyromark sequencing is underlined. C. Methylation frequencies of CpG sites in the HGK promoter from 163 subjects. Genomic DNA from peripheral blood mononuclear cells (PBMCs) was used. Graphs depict methylation frequencies at the positions 1-14 or positions 32-43 from NGT (n = 49) and T2D (n = 114); graphs depict methylation frequencies at the positions 15-31 from NGT (n = 49) and T2D (n = 87; data of 27 samples were undetectable). Means ± SEM are shown. D. Relative HGK mRNA levels in T cells from healthy controls (n = 4) and insulin-resistant patients (n = 10) before and after treatment with the methyltransferase inhibitor 5-AZAC (4 μM) for 72 hours. The HGK mRNA levels were measured by quantitative real-time PCR. *, P value < 0.05; **, P value < 0.01; ***, P value < 0.001; ****, P value < 0.0001.
