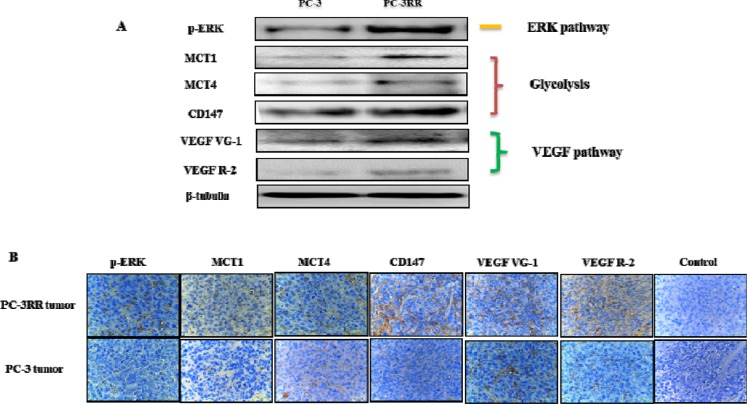
Figure 4. Overexpression of key proteins from ERK, Glycolysis, VEGF pathways observed in PC-3RR cell line and PC-3RR s.c xenograft tumors.
A. The representative images showing increased expression of p-ERK, MCT1, MCT4, CD147, VEGF VG-1 and VEGF R-2 (pathway associated proteins) in PC-3RR CaP cells compared with PC-3 cells by Western blotting. β-tubulin was used as a loading control. B. Representative images showing increased expression of p-ERK, MCT1, MCT4, CD147, VEGF VG-1 and VEGF R-2 in PC-3RR s.c. xenografts compared to parental PC-3 xenografts using immunohistochemistry. Brown indicates positive staining while blue indicates nuclear staining. Magnification in all images x 40. All data were from three independent experiments (n=3).

