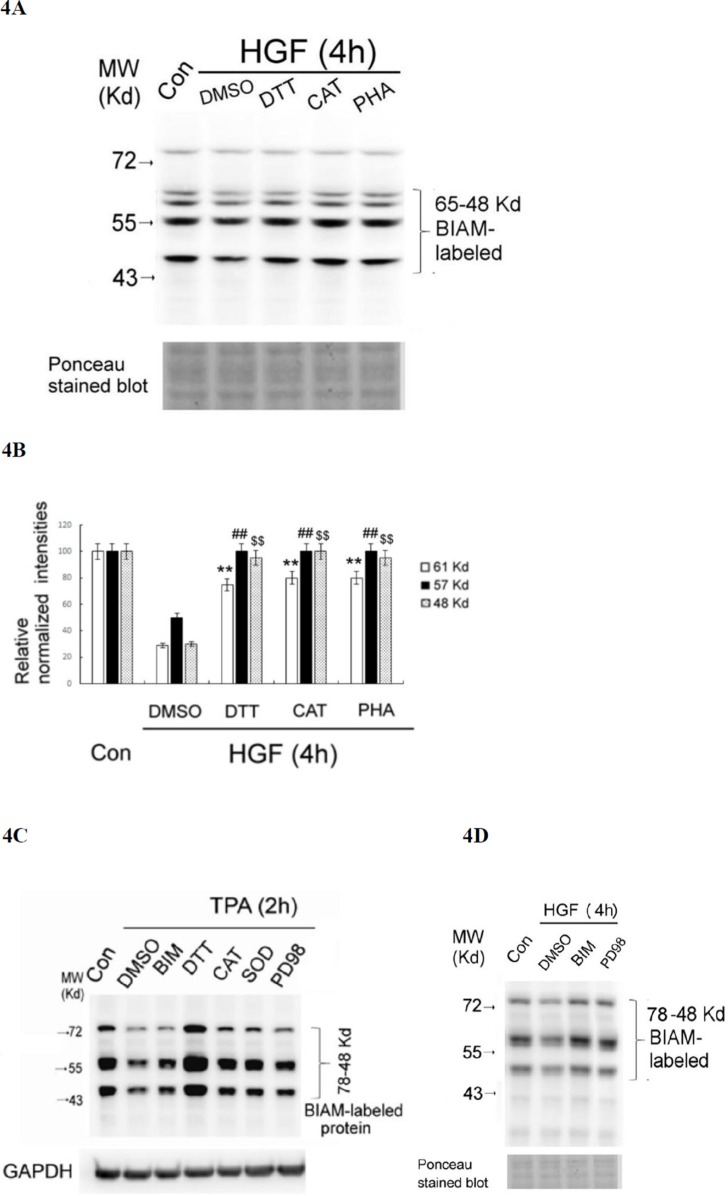
Figure 4. HGF- and TPA- induced reduction of SH-containing proteins were prevented by ROS scavengers and various inhibitors.
HepG2 were untreated (Con), treated with 25 nM HGF or HGF coupled with indicated inhibitors for 4 h (A, D), or treated with 50 nM TPA or TPA coupled with indicated inhibitors for 2 h (C). After indicated times, the cell were harvested for affinity blots of BIAM-labeled proteins using avidin-HRP. Nonspecific bands in Ponceau stained blots (A, D) or GAPDH (C) were shown for normalizing the band intensities of redox sensitive proteins. (B) is the quantitative figure for (A). Relative intensities for the normalized redox sensitive proteins with indicated M.W. were estimated, taking the data of the untreated cells as 100. (**) (##) and ($$) represent statistical significance (Student's t test: p < 0.005; N = 3) for differences of the proteins with M.W. of 61, 57, 48 Kd, respectively, between the indicated HGF/inhibitor and the HGF/DMSO groups. (C) and (D) are representatives of two reproducible experiments.

