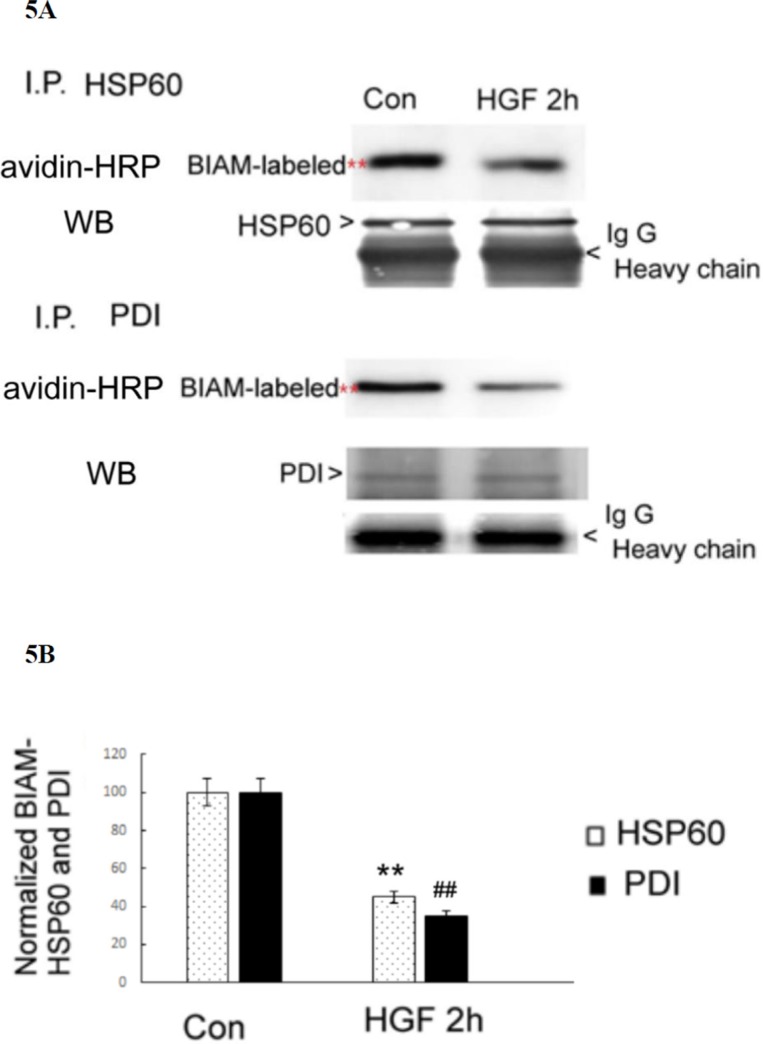
Figure 5. HGF suppressed SH-containing HSP60 and PDI in HepG2.
(A) HepG2 were untreated (Con) or treated with 25 nM HGF for 2 h. Immunoprecipitation (IP) of HSP60 or PDI were performed followed by affinity blots using avidin-HRP for BIAM-labeled proteins. For the internal control, IP of HSP60 and PDI followed by Western blots for either protein were performed. IgG H (heavy chain of immunoglobin G) are indicated below each blots for additional IP control. The positions of BIAM-labeled HSP60 and PDI were indicated by red stars whereas those of HSP60, PDI and IgG H were indicated by arrow heads. (B) is the quantitative figure for (A). Relative intensities for the normalized BIAM-labeled HSP60 and PDI were calculated, taking the data of untreated cells as 100. (**) and (##) represent statistical significance (Student's t p < 0.005; N = 3) for intensity differences of BIAM-labeled HSP60 and PDI, respectively, between the HGF-treated and control groups.

