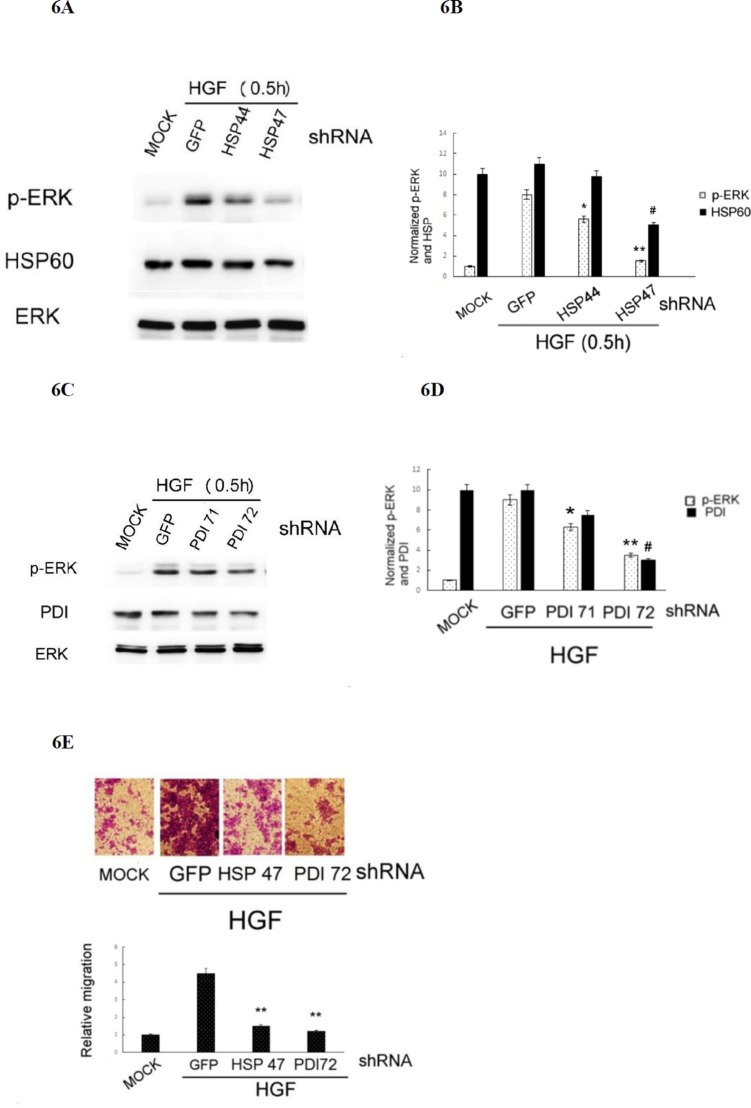
Figure 6. Depletion of HSP60 or PDI prevented HGF-induced ERK phosphorylation and HepG2 cell migration.
(A) HepG2 cells were transiently transfected with none (MOCK), GFP shRNA (as control shRNA) or various shRNA fragments of HSP60 (A) and PDI (C) for 36 h followed by treatment with 25 nM HGF for 30 min. Western blot of p-ERK (A) and (C), HSP60 (A) and PDI (C) were performed, using ERK for normalizing the band intensities. (B) and (D) are the quantitative figures for (A) and (C), respectively. Relative intensities for the normalized proteins were calculated, taking the data of MOCK samples as 1.0. (**), (*), (##) represent statistical significance (Student's t p < 0.005; p < 0. 05; p < 0.005, respectively n = 3) for intensity differences of p-ERK between the indicated shRNAs and the control GFP shRNA groups. (E) HepG2 cells were transiently transfected with none (MOCK), shRNA of GFP (as a control shRNA), HSP60 (HSP 47 plasmid) and PDI (PDI 72 plasmid) for 36 h followed by treatment with 25 nM HGF for 48 h. Transwell migration assay were performed. Pictures were taken under phase contrast microscope (200 × magnification) (upper panel) and the migrated cells were quantitated (lower panel). Relative migratory activity was calculated, taking the data of MOCK sample as 1.0. (**) represent statistical significance (Student's t test: p < 0.005, N = 3) for differences of relative migratory activity between the indicated shRNA and the GFP shRNA groups.

